Appliance Replacement Waves: Predicting White-Goods Supply
Predict appliance replacement waves to forecast scrap metal supply. Master the drivers—economic cycles, policy, and tech—and leverage scenario planning to secure feedstock and optimize recycling operations.
SCRAP METAL TRADE & POLICY
Introduction
The white-goods market—a sector encompassing major household appliances such as refrigerators, washing machines, ovens, and dishwashers—is intimately linked to the global metals and recycling industries. As these appliances reach the end of their lifecycle, they become significant sources of scrap metals, feeding supply chains and influencing commodity pricing. The rhythm at which old appliances are replaced, often termed "appliance replacement waves," is not just a matter of kitchen makeovers—it's a complex phenomenon driven by consumer economics, macroeconomic factors, technological evolution, and regulatory shifts.
For stakeholders across the supply chain—original equipment manufacturers (OEMs), scrap yards, metals processors, commodity traders, recycling service providers, and institutional investors—predicting the timing, volume, and nature of these replacement waves isn’t just useful; it’s mission-critical. Accurate forecasting enhances procurement, inventory management, and trading strategies, while also informing sustainability and circular economy goals.
White-goods replacement patterns also serve as leading indicators for broader industrial trends, echoing the health of construction, retail, and energy sectors. Given that nearly 90% of the metal in discarded appliances is recoverable, according to the Institute of Scrap Recycling Industries (ISRI), the stakes extend far beyond manufacturing lines. Every spike in appliance disposal ripples through steel, aluminum, copper, and even plastics markets globally.
In this article, we’ll analyze the nuanced drivers behind appliance replacement, present scenario-based forecasts supported by recent data and industry analysis, and offer actionable insights for both buyers and sellers navigating the metal industry’s shifting tides. Whether you are a strategic buyer, a procurement manager, a recycling professional, or an industry investor, understanding and anticipating these appliance replacement cycles is key to seizing opportunities and minimizing disruption.
Market Drivers: Unpacking Appliance Replacement Waves
Aging Installed Base
At the core of the appliance replacement cycle lies the installed base—a living map of millions of refrigerators, washers, and ovens sitting in homes, offices, and businesses. Most white goods carry predictable average lifespans—typically 15 years for refrigerators, 10–12 years for washing machines and dishwashers, and about 10–15 years for ovens. When a cohort of appliances sold in a particular year or economic cycle approaches its end of life, the market can expect a “scrap flow” spike roughly a decade or so later.
Demand Surges Create Predictable Scrap Bubbles
A look at historical shipment data supports this cyclical principle. For example, in the United States, the post-2008 financial crisis saw a surge in appliance purchases due to government stimulus programs, such as the High-Efficiency Appliance Rebate Program (HEARP) and state-level incentives. The Association of Home Appliance Manufacturers (AHAM) reported a 12% increase in shipments between 2009 and 2011. Fast-forward to the 2020s—those very appliances have begun reaching their natural end-of-life, with U.S. scrap yards reporting double-digit percentage increases in white-good intake compared to a decade before.
Global Example:
China’s “Home Appliances Going to the Countryside” initiative, active from 2009–2012, led to tens of millions of new units installed in rural households. In the 2020s, this is resulting in a parallel wave of obsolete appliances entering recycling streams.
Industry data underscores this connection: in the EU, a 2019 Eurostat report showed a 7% annual increase in the collection of large household appliances over the preceding five years, mirroring earlier new sales spikes.
Economic Trends and Consumer Behavior
White-goods replacement is highly sensitive to economic variables and the evolving psychology of the consumer:
Housing Market Growth:
New home construction acts as a direct catalyst for new appliances; every house built requires a suite of white goods. In 2021 alone, the global housing completion rate hit its highest level since 2007. Real estate turnover also spurs upgrade cycles, as buyers seek modern, more efficient products.Disposable Income and Consumer Confidence:
Nielsen research indicates that during periods of economic growth, up to 40% of appliance buyers cite “desire for better features” as a replacement driver—signifying that upgrades, not just breakdowns, push replacement rates higher.Recessionary Pressure:
Economic downturns reshape consumer priorities. According to Deloitte’s Global State of the Consumer Tracker (2022), over 30% of U.S. consumers delayed major home purchases when inflation soared. This leads to a “snake swallowing the elephant” effect: flat scrap flows during downturns, followed by pent-up “catch-up” waves as economic sentiment rebounds.Incentive Programs:
Government-led programs like the US “Cash for Appliances” (2010) injected more than $300 million in rebates, resulting in immediate spikes in sales. These direct interventions have a clear echo, typically a decade later, as those incentivized appliances cycle out.
Case Study: Pandemic Impacts on White-Goods Demand
During the COVID-19 pandemic, lockdowns shifted consumer spending towards home upgrades. According to Whirlpool Corporation, global appliance sales grew 8.2% in 2021 versus pre-pandemic levels. As this bubble of recently purchased appliances matures, the industry can anticipate a corresponding spike in end-of-life units beginning around 2033–2035.
Regulation and Environmental Policy
Legislative and environmental regulations have become powerful agents of change affecting white-goods life cycles and recycling volumes.
Ecodesign and Energy Efficiency Standards:
The European Union’s Ecodesign Directive and similar regulations in Japan and the United States set minimum efficiency standards, effectively phasing out older, less efficient models. The International Energy Agency (IEA) estimates that appliance-related regulations trimmed the average energy consumption of European refrigerators by 60% between 1990 and 2020. As new, stricter rules are adopted, waves of premature retirements follow.Scrap Management and Recycling Rules:
Extended Producer Responsibility (EPR) mandates—now in force in more than 30 countries—hold manufacturers accountable for end-of-life recovery. This transition has boosted collection rates; for instance, Japan’s Home Appliance Recycling Law led to a 97% collection rate for key appliance categories in 2021, per METI statistics.Hazardous Material Regulations:
Restrictions on cooling refrigerants (CFCs, HFCs), heavy metals, and plastics are pushing older appliances off the grid more rapidly, as compliance costs for repairs mount.
Global Perspective:
China’s circular economy laws require up to 80% recycling rates for end-of-life appliances in major cities. As more countries tighten EPR frameworks and recycling quotas, the pool of available secondary metals is set to expand and become more reliable—provided infra-structural and enforcement hurdles are overcome.
Technological Innovation
The accelerating pace of innovation is reshaping consumer expectations and product lifespans:
Smart Appliances and IoT Integration:
The proliferation of connected home products—forecasted to represent 59% of new appliance sales by 2027 according to Statista—means consumers now expect features like remote diagnostics, voice assistance, and seamless integration. This desire for the latest tech drives early replacements, decoupling replacement rates from mechanical failure.Efficiency Upgrades:
The introduction of inverter compressors, energy-efficient motors, and water-saving technologies significantly lowers operating costs; this draws consumers towards replacement even for still-functioning appliances. Research from Energy Star estimates households can save up to $200 per year by upgrading older models, motivating swaps ahead of breakdown.Product Aesthetics and Design:
Kitchen and laundry room renovations often mean aesthetic upgrades, further accelerating turnover, especially in developed markets.
Industry Trend:
OEMs such as Samsung, Electrolux, and LG are investing heavily in machine learning-enabled appliances, betting that predictive maintenance and automation will shrink average replacement cycles by as much as 20% over the next decade.
Scenario analysis: 2026 to 2035
You will face two clear replacement cohorts that shape scrap flows through the next decade. The first sits in the 2010 to 2012 window when US rebate programs lifted sales. Those refrigerators and washers reach 10 to 15 years of age across 2020 to 2027, with the tail into 2028. Expect a visible uptick in disposals in 2026 to 2028, strongest in metros with retailer take-back and bulky pickup. The second cohort formed in 2020 to 2021 when households upgraded during lockdowns. Premium buyers churn faster because of features and energy savings, so you will see a trickle before the main wave. The bulk of that wave enters yards in roughly 2033 to 2036.
Policy will pull some of this forward. China seeded a large installed base with its 2009 to 2012 rural program, then launched a national trade-in push in 2024 to 2025. That creates a front-loaded disposal burst in 2025 to 2027, especially in coastal provinces where retail executes faster. In Europe, collection rates for large appliances improved through 2019, then slipped as sales outpaced formal capture. Regulators are tightening enforcement, so expect a grind higher in 2026 to 2029. Where rules bite, more tonnage reaches compliant channels and less leaks to informal buyers.
What the waves mean in metal
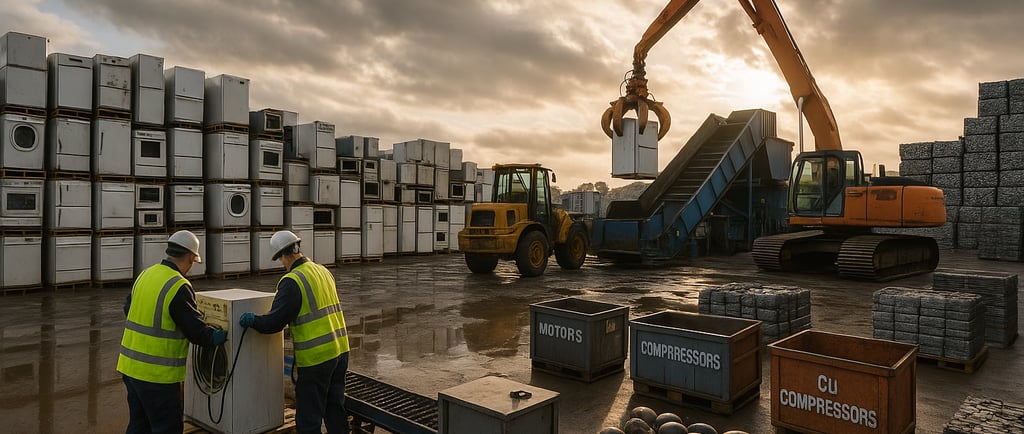
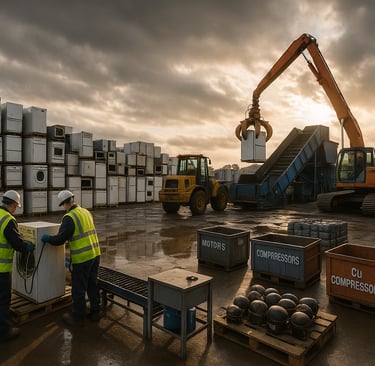
You can size flows with simple unit math. A typical refrigerator weighs about 267 pounds, roughly 121 kilograms. A washing machine runs 60 to 80 kilograms. Net metal yield depends on preparation and route. For washers, metal is often 50 to 60 percent of total weight. For fridges, ferrous dominates, with copper and aluminum in motors and coils adding value. A hermetic compressor weighs about 6 to 10 kilograms and contains copper windings and tubing, so pulling compressors early moves your margin.
Use this quick converter when scoping programs. One million end-of-life refrigerators equal about 121,000 tonnes of gross weight. If 70 percent is recoverable metal after depollution and handling losses, you place roughly 84,700 tonnes of metal. One million washing machines at 70 kilograms each, with 55 percent metal, yield about 38,500 tonnes. These are planning numbers, not offer terms, but they let you translate retailer campaigns into truck counts and shredder shifts.
Shredder residue deserves attention. White goods often enter mixed shred streams with end-of-life vehicles. Plastics and foams drive residue, so non-metal outflow on unsorted loads can sit in the 20 to 30 percent range. Better depollution, foam management, and pre-sort lift metal recovery and keep you inside permit limits.
Three scenarios you should plan against
In the base case for 2026 to 2028, US collections rise 10 to 15 percent above 2018 to 2019 baselines where services are mature. Shredder utilization tightens in spring and fall as municipal calendars cluster. In Europe, stricter supervision nudges capture higher but several states still sit below the 65 percent target, so leakage narrows but does not vanish. In China, trade-ins drive visible surges near big box chains through 2027, then flows settle back. Net effect for metals is better light-iron availability, mild pressure on substitutes for prime, and stronger nonferrous by-products in peak months.
In an upside, policy-led surge, extra rebates or new trade-in rounds bring retirements forward by six to twelve months. A one-off 10 percent uplift in refrigerator retirements adds about 8.5 thousand tonnes of metal per million units in that window. Local supply to shredders can be strong enough to shave regional HMS premiums by three to eight dollars per tonne for a few weeks, subject to furnace outages and export pulls.
In a downside, delayed-turnover case, high rates or weak housing slow upgrades. Collections slip five to ten percent versus the base case in 2026. Informal flows grow. Shredders backfill with demolition and vehicle feed. A firm import pull into Turkey or strong Asian billet margins can absorb surplus and steady prices even if local inflows dip.
Signals you should track each month
Watch shipment indices by category. Spikes a decade ago point to today’s disposals. Pair that with housing completions and existing-home sales in your markets because moves and renovations nudge upgrades. Follow retailer trade-in calendars and municipal bulky-waste schedules. Read WEEE enforcement bulletins and retail compliance actions for hints on capture rates. Track shredder downtime because a two-week outage can move local bids. Keep an eye on connected appliance launches, including Matter-ready lines, since early adopters replace sooner.
Actionable strategies, by role
If you run a yard or collection business
time your intake to the calendar. Plan appliance weeks around municipal pickups and retailer trade-ins, and pre-book trucks and bins for two to three times normal volume. Add a simple depollution lane that handles refrigerants, oils, foam, and mercury checks where required. This protects price and avoids costly rework. Remove compressors and motors at intake. The extra copper recovery changes the economics of white-goods loads. Lock supply during peak programs with short agreements that specify depollution standards, moisture, photo proof on intake, and a weekly escalator tied to mill buy prices. Commit to pickup within 48 hours so material does not leak to informal buyers.
If you operate a shredder
schedule maintenance outside policy windows. Upgrade downstream separation so eddy current and sensors pull more nonferrous from motors and coils. Treat ASR quality as a compliance risk, not a byproduct, and invest in light-fraction handling because plastics and foams drive costs. Offer seasonal premiums for clean, verified depolluted bales to secure throughput without choking your system.
If you trade or broker
build a metro-level tonnage model. Multiply units retired by average kilograms, by metal yield, by capture rate. For example, 200,000 fridges at 121 kilograms with 70 percent metal and 65 percent capture equals about 11,000 tonnes to place. Stress-test capture up and down by ten points. Hedge directional risk with liquid scrap benchmarks where available, then manage basis locally. When retailers announce trade-ins, book local haulage early, then containers or coasters, because short-haul tightens first.
If you buy for an EAF or an integrated mill
expect cleaner light-iron flows where WEEE rules tighten. Publish acceptance specs for residuals and set short-term premia for better lots. Explore reverse-logistics pilots with retailers. A fixed bounty per verified unit, paid quickly, secures predictable feed for your shredder partners and lets you shape quality.
If you are an OEM or retailer
use trade-in math to balance inventory and build loyalty. Converting only five percent of your installed base can generate returns that keep regional metal partners busy for months. Post clear take-back calendars so yards and haulers can plan capacity. Sell the energy savings story because buyers understand that a newer fridge cuts power use by more than half compared with older models. That message accelerates upgrades and feeds your reverse pipeline.
Numbers worth keeping in your head
US rebate programs around 2010 totaled about 300 million dollars, so the echo in 2026 to 2028 is real. European policy cut fridge energy use by roughly half across two decades, which pulls replacements forward. Japan collected more than 15 million appliances in 2021 under a clear, fee-backed system, showing high capture is possible. Planning weights matter. A refrigerator is about 121 kilograms. A washer is 60 to 80 kilograms. In Europe, collection rates reached the high 40s before slipping into the low to mid 40s, so enforcement intensity will drive regional outcomes. Smart and connected features shorten cycles for early adopters, which brings a steady trickle ahead of the main wave.
Your next 90 days
Map the 2010 to 2012 sales bulge to your city or state and turn it into a 2026 to 2028 disposal forecast. Sign a six-month memorandum with two retailers and one municipality that spells out depollution and photo proof. Add a compressor and motor lane and track copper kilograms recovered per incoming tonne. Pre-price two container lanes and two coaster options for likely peak months. Stand up a weekly signals log that covers retail campaigns, bulky-waste calendars, shredder downtime, WEEE actions, and housing turnover. Agree a seasonal premium with your preferred shredder for clean white-goods bales so you have a home for volume when the wave hits.
Conclusion
Appliance replacement waves are predictable enough to plan around. The next visible bulge sits in 2026 to 2028 from the 2010 to 2012 sales spike. The following surge arrives in 2033 to 2036 from the 2020 to 2021 upgrade boom. Your goal is simple, convert those calendars into weekly metal flows you can secure and move.
Policy and compliance will decide how much of that volume you actually see. Strong take-back programs, clear depollution, and tight retailer execution raise capture and quality. Loose enforcement leaks tonnage to informal channels and lowers yields. Build relationships where compliance is real, then price for consistency.
Treat this market like an operating model, not a headline. Track shipment cohorts by year, housing turnover, retailer trade-ins, WEEE actions, and shredder uptime. Keep a rolling 12-month forecast and refresh it every month. Adjust bids, trucking, and yard labor to match the signal, not the noise.
Make the next year count. Lock two retailer MOUs and one municipal partner. Stand up a fast depollution lane and measure copper kilograms per incoming tonne. Publish acceptance specs with your shredder or mill and agree a seasonal premium for clean, dry, verified bales. Put a simple dashboard on one screen and review it every Monday.
If you do the math first, you win feedstock, yield, and predictability. You cut risk, improve margins, and meet compliance with less friction. Replacement waves will keep coming. The operators who prepare will turn each wave into steady, bankable metal.
Connect
Your trusted partner for scrap metal procurement.
CONTACT
About
haroon@tdcventures.com
+1-307-655-7593
© 2025. All rights reserved.
NEWSLETTER