Design KPIs for Electronics Circularity: XR Recycling & Repair Metrics
Discover how to design KPIs for electronics circularity in XR devices. Track repairability, refurbishment yield, and recycling metrics to drive real sustainability impact and ESG compliance.
IMMERSIVE TECH RECYCLING & CIRCULAR ELECTRONICS
Instant Answer
To design KPIs for electronics circularity in XR and emerging electronics, track metrics across product repairability, recyclability, recycled material content, collection rates, refurbishment yield, and end-of-life recovery. These KPIs keep DfE, ESG, and sustainability teams focused on scaling responsible recycling and closed-loop design improvements, ensuring real circularity impact.
Table of Contents
Context: Why Electronics Circularity KPIs Matter
Circularity Challenges in XR and Emerging Electronics
Defining Core Terms and Concepts
The Circularity KPI Framework: From Design to Recycling
Building the Circularity KPI Implementation Playbook
Measurement: Scorecards and Weekly QA
Case Patterns: Circular Electronics in Action
FAQs: Circularity KPI Edition
Competitive Differentiation (Market Gaps and Upgrades)
Conclusion
1. Context: Why Electronics Circularity KPIs Matter
The rapid rise of XR devices—including VR headsets, AR glasses, and mixed-reality hardware—is fueling both unprecedented innovation and growing sustainability challenges. As adoption accelerates, so do concerns about electronic waste (e-waste), resource scarcity, and mounting pressure on supply chains. According to Statista, global e-waste reached over 59 million metric tons in 2022, and the electronics sector—including XR—bears significant responsibility for reversing this trend.
For electronics manufacturers (OEMs), environmental, social, and governance (ESG) leaders, and design for environment (DfE) teams, the shift toward a circular economy is no longer just aspirational, but a strategic imperative. Successful implementation means proving—not just claiming—that XR devices are designed for longevity, actively collected at the end of their first life, efficiently refurbished or recycled, and that valuable materials are channeled back into new devices.
Circularity KPIs (Key Performance Indicators) are the linchpin of meaningful progress. They:
Fulfill regulatory requirements (including EU Circular Economy Action Plan and national e-waste policies).
Manage operational risk by ensuring critical materials (like rare earths) are recaptured and reused.
Satisfy customers and investors prioritizing sustainability performance.
Enable data-driven improvements in design, sourcing, logistics, and product lifecycle management.
In summary, robust, granular, and actionable KPIs align stakeholders, support transparent reporting, and catalyze continuous improvement across the product lifecycle. They safeguard brand value and market access while enabling genuine ESG-driven transformation.
2. Circularity Challenges in XR and Emerging Electronics
XR and similar advanced electronics highlight the most difficult frontiers of circularity. Product life cycles are shortening as innovation races ahead. Devices are increasingly compact, with components—like miniaturized sensors and batteries—densely packed into small, complex assemblies.
Key Obstacles:
Repairability Hurdles:
XR hardware often uses advanced adhesives, lamination, or component miniaturization to drive performance and sleeker design. Unfortunately, this impedes disassembly and repair. For example, once-glued lithium batteries or fused display modules hamper the extraction of high-value materials and reduce refurbishment rates.Fragmentation in Collection and Take-Back Systems:
Unlike smartphones (with established collection programs), XR and wearables often lack reliable, standardized take-back channels. Without proper infrastructure, even well-designed reclaimable devices end up as landfill or e-waste.Data Deficiency for Refurbishment:
Transparent, traceable part data is needed to refurbish or harvest components. Many XR products lack standardized part coding, serial numbers, or unique IDs, complicating the identification, grading, and reuse of components during reverse logistics operations.Recycled Material Integration Shortcomings:
The recycling sector’s ability to close the loop for rare earth elements, specialty plastics, and high-grade metals remains underdeveloped. As a result, new builds rarely exceed 10–20% recycled input, according to industry surveys.
The absence of standardized, robust metrics across these domains leads to greenwashing, where “processed” or “recycled” labels mask true landfill diversion or circularity. Only verified, granular KPIs limit reputational and regulatory risk, empowering organizations to pivot processes and product strategies for measurable, authentic impact.
3. Defining Core Terms and Concepts
Core Circularity Language—and Why It Matters
To optimize your reporting and operations, start with a solid vocabulary:
Circularity KPI: Quantifiable metric indicating how well electronic products (e.g., XR headsets, wearables) achieve repair, recycling, and closed-loop objectives throughout the lifecycle.
Design for Repair: Engineering strategies that maximize modularity, safe disassembly, and economic repair. For example, prioritizing screws over glue or including repair manuals and labeled parts.
Refurbishment Yield: The proportion of returned devices or components successfully restored for reuse/resale—a critical viability and profitability indicator for reverse logistics.
Collection Rate: The share of total sold units reclaimed via authorized end-of-use return pathways (not only those processed, but physically received).
Recycling Rate: Percentage of materials—by mass or component count—actually reintegrated into high-value recovery streams, not simply processed or downcycled.
Closed-Loop Content: Portion of recycled or reclaimed material used in new device manufacturing, representing a direct measure of circularity success.
XR Electronics: Hardware enabling immersive AR, VR, or MR experiences. These devices, often miniaturized and densely integrated, present unique circularity and sustainability hurdles.
Mastery of these terms allows teams to communicate progress, diagnose failures, and standardize reporting for compliance and comparative benchmarking across business units and supply chains.
4. The Circularity KPI Framework: From Design to Recycling
A robust KPI framework for electronics circularity must follow the full product lifecycle. This ensures that every relevant phase—design, collection, refurbishment, recycling, and material reintegration—is measured and managed to drive actionable improvements. Let’s break down each phase and the key KPIs associated with it.
Step 1: Design Metrics
Repairability Index:
Quantifies the ease with which a device can be disassembled for repair or material recovery. Factors include fixings versus adhesives, accessibility of components (e.g., battery, screen), standardization of screws, and availability of repair documentation.
Best Practice: Adopt internationally recognized schemes such as France’s Repairability Index or iFixit’s teardown scoring as a benchmarking baseline.Standardized Part Documentation:
Track detailed Bill of Materials (BoM) and unique part IDs, ensuring traceability. Effective part documentation boosts refurbishability, supports material recovery, and streamlines warranty/recall processes.
Example Attribute: QR codes or RFID tags on major assemblies for digital tracking and end-of-life management.
Step 2: Collection & Return Metrics
Device Return Rate:
Percentage of devices sold that are ultimately collected via authorized take-back programs. This KPI directly reflects the effectiveness of outreach strategies, incentives, and supply chain partnerships.Active Collection Points:
Geographic density and utilization of collection sites (e.g., retail partners, mail-back options) as a proxy for program accessibility and convenience.
Step 3: Refurbish and Remanufacture Metrics
Refurbishment Rate:
Ratio of devices/components suitable for reuse or resale after inspection and initial diagnostic. This metric underpins business viability for refurbishment-led circularity and is critical for financial, regulatory, and ESG reporting.Recovery Yield:
Tracks high-value components (like processors, cameras, lithium cells) successfully extracted for secondary use or repair stockpiling—a leading indicator for supply chain resilience.
Step 4: Recycling and Closed-Loop Metrics
True Recycling Rate:
The share of non-refurbished material that re-enters equivalent (or higher) value streams—e.g., rare earths from an old headset used in new headsets, not downcycled to construction fill or incinerated.Recycled Content Input:
The proportion of post-consumer (not just post-industrial) recycled content used during new manufacturing cycles. Regulatory bodies and eco-labels (like EPEAT or TCO Certified) are increasingly mandating transparency in this area.Material Recovery Rate:
Specifically measures the yield of critical and high-value materials recovered throughout the process. This is vital for risk mitigation as OEMs combat supply chain shocks and resource constraints.
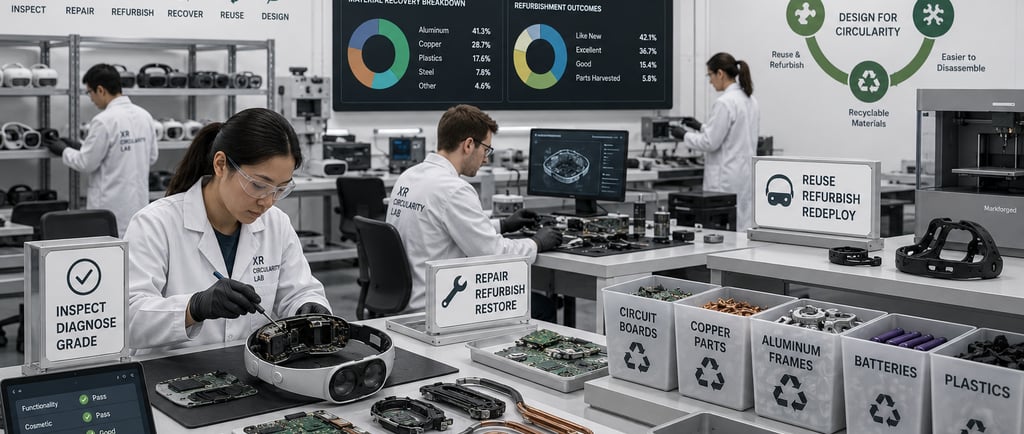
Worked Example (Target Niche: New AR Headset)
Let’s bring the KPI methodology to life with a fictional, data-driven scenario:
Product: Next-gen AR Headset
Annual Sales Volume: 10,000 units
Design Phase:
Repairability Index: 8/10 (battery compartment is screw-secured and labeled; display modules modular; minimal adhesive used).
Part Documentation: All major assemblies tagged with digital QR codes for traceability.
Collection Phase (After 24 months):
Device Return Rate: 37% (3,700 headsets returned via prepaid mailer, retail drop-off, B2B partner collections).
Active Collection Points: 50 across the main operational cities.
Refurbishment Phase:
Refurbishment Yield: 55% (2,035 devices restored and cleared for resale or lease).
Recovery Yield: 80% extraction success for high-value sensors and battery modules.
Recycling Phase:
True Recycling Rate: 82% for non-refurbished devices (1,329 headsets processed through advanced recycling, with documentation proving high-value material re-integration).
Recycled Content Input: New units produced with 12% post-consumer recycled polymers and metals.
Material Recovery Rate: 90% for key metals (rare earths, copper, aluminum).
This sample illustrates how integrated KPIs can surface strengths, expose bottlenecks, and provide benchmarkable data for internal improvement and stakeholder reporting.
Building the Circularity KPI Implementation Playbook
Circularity KPIs fail when they stay inside sustainability reports. They start creating real value when they become part of product design reviews, sourcing decisions, supplier scorecards, warranty operations, reverse logistics, refurbishment planning, and recycling contracts. For XR devices, this matters because the product is not a simple plastic shell with a battery. A headset can include displays, cameras, lenses, speakers, sensors, magnets, printed circuit boards, lithium-ion cells, copper, aluminum, rare earth elements, flame-retardant plastics, adhesives, textiles, foam, coatings, and firmware-linked components. If the KPI system only measures “units recycled,” it misses most of the circularity story.
The first step is to assign KPI ownership across the full device lifecycle. Design teams should own repairability, disassembly time, part standardization, adhesive reduction, modularity, and documentation completeness. Procurement should own recycled content, verified material origin, supplier disclosure, and component-level traceability. Reverse logistics should own return rate, collection route efficiency, grading accuracy, refurbishment yield, and time from return to resale. Recycling partners should own material recovery rate, yield by material type, contamination rate, landfill diversion, and proof of downstream processing. Finance should own cost per returned unit, avoided new-part spend, resale margin, warranty recovery value, and total cost per lifecycle extension.
This structure matters because global e-waste reached 62 million tonnes in 2022, while only 22.3% was documented as properly collected and recycled. The same UN-backed research projects global e-waste to reach 82 million tonnes by 2030 if current patterns continue. That means circularity KPI systems must measure what happens before waste appears, not only what happens after disposal. The best metric is often the one that prevents a device from entering the waste stream in the first place.
For XR manufacturers, the KPI playbook should begin at the product requirements document stage. Before engineers lock the industrial design, the company should define circularity design targets. These targets should include maximum battery access time, maximum number of tool types required for teardown, target percentage of reusable fasteners, maximum adhesive coverage on serviceable parts, target percentage of replaceable modules, number of parts covered by repair manuals, and minimum recycled content by material family. A headset that needs 45 minutes, heat, solvents, and destructive prying to remove a battery is not circular, even if the company later pays a recycler to process it. A headset that lets technicians replace the facial interface, battery module, charging port, lenses, speakers, head strap, and sensor module with basic tools has a stronger chance of being repaired, leased, redeployed, or harvested for parts.
The second step is to create a circularity bill of materials. A standard bill of materials tells the company what went into the device. A circularity bill of materials tells the company what can come back out. It should classify each part by material type, weight, hazardous content, recovery pathway, disassembly sequence, reuse potential, recycled content, supplier disclosure status, and downstream value. For example, copper flex circuits, aluminum structural parts, neodymium magnets, lithium-ion batteries, high-grade polymers, camera modules, optical assemblies, and printed circuit boards should each have separate recovery logic. This lets a company identify which design changes increase recovery value and which components create processing losses.
The EU’s Ecodesign for Sustainable Products Regulation, Regulation (EU) 2024/1781, raises the stakes here. It aims to improve product circularity, energy performance, and environmental sustainability for products placed on the EU market. The regulation also brings Digital Product Passport requirements into the wider policy direction, linking future product access to better product data, traceability, durability, repairability, reusability, and recyclability information.
For XR teams, this means circularity KPIs should be built with digital product data in mind. Each major device family should have a product passport-style data record that captures material composition, recycled content, repair instructions, spare part references, battery chemistry, hazardous substance declarations, firmware reset process, refurbishment test requirements, and end-of-life handling instructions. The goal is simple: when a returned headset arrives at a refurbishment center in 2028, the technician should not need to guess what battery, display, adhesive, screw type, or sensor version is inside.
The third step is to build a grading system for returned devices. XR returns do not all have the same fate. Some are cosmetic returns. Some have battery wear. Some need a new facial interface. Some have lens damage. Some have liquid exposure. Some are blocked by account locks or enterprise device management. Some are unsafe due to swelling batteries or exposed wiring. Without a clear grading system, teams over-recycle devices that could be refurbished or over-repair devices that should be harvested for parts.
A practical grading model can use five grades. Grade A devices are fully functional and need cleaning, testing, and repackaging. Grade B devices need minor parts, such as straps, cushions, cables, or controllers. Grade C devices need deeper repair, such as battery, lens, display, speaker, charging port, or sensor replacement. Grade D devices are parts-harvest candidates. Grade E devices are hazardous, locked beyond recovery, contaminated, or suitable only for certified recycling. The KPI is not only the share of devices in each grade. The stronger KPI is conversion rate by grade. For example, if 60% of Grade C devices can be repaired within a target cost threshold, the company can use that data to redesign weak components, improve parts planning, or improve technician training.
The fourth step is to connect circularity KPIs to procurement. Procurement teams often focus on price, lead time, supplier reliability, and quality. Circularity adds another layer. Suppliers should be scored on recycled content disclosure, material traceability, spare part availability, repair documentation, packaging recovery, take-back cooperation, and willingness to support closed-loop material trials. If a supplier cannot disclose the polymer grade in a headset housing, cannot confirm recycled aluminum content, or cannot support part-level serial tracking, the company should treat that as a future compliance and recovery risk.
Apple offers a useful case pattern, even though XR hardware has its own design limits. Apple reported that 30% of the material used in products shipped in 2025 came from recycled sources. It also reported high recycled material use in categories such as rare earth elements, cobalt, lithium, gold, copper, tin, tungsten, and aluminum. This shows how recycled content targets can move from sustainability language into product material planning when they are tracked across specific material families.
The fifth step is to use circularity KPIs during pilot builds, not after mass production. During engineering validation and production validation, companies should run teardown tests, battery removal tests, parts replacement tests, cleaning tests, diagnostic tests, firmware reset tests, and recycler yield tests. A sample of pre-production units should go through a simulated end-of-life process. The team should record disassembly time, damaged part rate, tool count, adhesive removal difficulty, technician safety concerns, material separation quality, and percentage of parts that can be reused. If the product fails these tests, the design should be corrected before scale production.
The sixth step is to tie KPIs to commercial models. Circularity is easier to fund when it links to money. For XR devices, that can include enterprise leasing, device-as-a-service programs, school take-back programs, refurbished resale, certified pre-owned devices, spare part harvesting, warranty recovery, and closed-loop material sourcing. A headset returned after 18 months should not automatically be treated as waste. It may still have resale value, parts value, training value, or material value. The KPI system should show the best next use.
A strong implementation playbook tracks circularity value in financial terms. That includes avoided replacement cost, recovered part value, resale revenue, warranty claim savings, avoided disposal cost, avoided virgin material cost, carbon reduction estimate, and compliance risk reduction. This lets sustainability teams speak the same language as finance and operations. When circularity lowers warranty costs, improves supply resilience, and creates secondary revenue, it becomes a business system, not a reporting task.
Measurement: Scorecards and Weekly QA
A circularity KPI system needs weekly discipline. Annual ESG reporting is too slow for XR hardware, where product cycles, firmware versions, accessories, and enterprise deployments can change quickly. A company may launch a headset in March, discover battery swelling issues in July, receive enterprise returns in October, and revise the product design before the next production run. If circularity performance is only reviewed once a year, the company loses the chance to correct the design while it still matters.
The scorecard should start with design KPIs. These include disassembly time, battery access time, number of tool types required, number of adhesives used on serviceable parts, share of replaceable high-failure components, repair manual completeness, spare part availability, and firmware reset success rate. These metrics belong in product design reviews. If a device scores poorly before launch, the issue should be treated like a quality defect. A product that cannot be serviced is a future waste problem and a future cost problem.
The next scorecard layer is return and collection performance. This should track the number of units sold, number of units eligible for return, number of units returned, return rate by region, return rate by customer type, collection channel mix, prepaid mailer use, retail drop-off use, enterprise bulk return volume, average time from return request to device receipt, and failed return rate. A weak return rate can mean poor customer awareness, poor incentives, weak logistics coverage, or low trust in the take-back process.
Collection must be measured separately from recycling. A company cannot repair, refurbish, harvest, or recycle a device it never receives. The Global E-waste Monitor’s 22.3% documented collection and recycling rate shows how much material disappears into informal, mixed, or untracked pathways. For XR devices, the risk is higher because many units are stored in drawers, resold informally, passed to schools or relatives, returned through warranty channels, or discarded with other small electronics.
The third scorecard layer is triage quality. This measures how accurately technicians classify returned devices. Important KPIs include first-pass diagnostic accuracy, grade reassignment rate, no-fault-found rate, repair misclassification rate, unsafe battery detection rate, and average triage time per device. If too many devices move from refurbishable to recyclable after deeper inspection, the triage process is weak. If too many recyclable devices enter repair queues, labor costs rise and technician time gets wasted.
The fourth scorecard layer is refurbishment performance. This should track refurbishment yield, repair success rate, parts replacement frequency, average labor minutes per repair, average parts cost per repair, retest failure rate, cosmetic rejection rate, battery health pass rate, firmware reset success, sanitation pass rate, and resale clearance rate. XR devices need stricter sanitation controls than many electronics because they contact the face, hair, skin, and eyes. A headset can be technically functional and still fail redeployment standards if facial interfaces, foam, straps, lenses, or contact surfaces cannot be cleaned or replaced safely.
The fifth scorecard layer is parts harvesting. This is where many circularity programs recover hidden value. A headset that cannot be refurbished may still contain working speakers, cameras, controllers, straps, batteries, lenses, sensor modules, charging ports, fans, circuit boards, screws, magnets, and housings. Teams should measure harvested parts per unit, tested-good part rate, parts reused in repair, harvested part inventory turnover, part failure rate after reuse, and avoided new-part purchase value. If harvested parts sit unused for six months, the company has not achieved circularity. It has created a new storage problem.
The sixth scorecard layer is recycling yield. This should measure material recovery by material type, not as one blended percentage. Copper, aluminum, steel, lithium-ion batteries, rare earth magnets, gold-bearing circuit boards, plastics, glass, lenses, foam, textiles, and packaging need separate tracking. Each stream has a different recovery route, value, contamination risk, and environmental impact. “82% recycling rate” is less useful than knowing that 93% of aluminum housings, 87% of copper-bearing material, 72% of circuit board mass, 64% of high-grade plastics, and 0% of foam interfaces were recovered into verified channels.
This is also where companies must avoid false comfort. A device can be “processed” without being circular. It can be shredded, sorted, exported, incinerated, downcycled, or blended into low-value outputs. A true recycling KPI should count verified material recovery into useful material streams, with downstream documentation. EPEAT’s model is relevant because it is based on criteria and independent third-party verification for electronics, which helps purchasers evaluate products against environmental and social criteria rather than relying only on brand claims.
Weekly QA should review exceptions, not only averages. Averages hide damage. If the average battery removal time is 12 minutes, but one product batch takes 31 minutes because of a changed adhesive supplier, the team needs to know. If one regional return hub has a 40% lower refurbishment yield, the issue may be packaging damage, training, spare part supply, or a broken diagnostic process. If one supplier’s plastic part contaminates a recycling stream, procurement needs to act before more units enter the market.
A practical weekly QA meeting should cover seven questions. What changed in return volume? Which product version created the most failures? Which parts were replaced most often? Which repairs failed retesting? Which materials had poor recovery yield? Which collection channels produced the best device condition? Which design issue should be fed back into the next engineering cycle? These questions turn scorecards into product improvement.
Monthly reviews should go deeper. They should compare circularity performance by product generation, customer segment, region, supplier, firmware version, repair center, and recycling partner. For example, a school deployment may show high cosmetic damage but strong return rates. An enterprise leasing client may show excellent collection rates but high battery degradation. Consumer retail units may have poor return rates but higher resale value when returned. These patterns should guide future design and business decisions.
Quarterly reviews should connect circularity KPIs to external reporting and regulation. EU repair rules, eco-design rules, right-to-repair momentum, buyer procurement standards, and investor reporting expectations are all moving toward stronger proof. Directive (EU) 2024/1799 on the repair of goods aims to promote repair of broken or defective products, with EU member state implementation tied to July 31, 2026 for key changes. That makes repair KPIs more than internal metrics. They are becoming market access and compliance tools.
The strongest scorecards include leading and lagging indicators. Lagging indicators show what happened: recycling rate, refurbishment yield, collection rate, resale revenue. Leading indicators show what will happen: spare part coverage, repair manual readiness, technician training completion, supplier disclosure rate, disassembly test pass rate, and product passport data completeness. A company that only tracks lagging indicators learns too late. A company that tracks leading indicators can prevent circularity failure before launch.
Case Patterns: Circular Electronics in Action
Circular electronics is no longer a theory. The strongest examples show the same pattern: better design, better product data, better return systems, better repair access, and better material recovery. XR companies can learn from smartphones, laptops, headphones, enterprise IT, and high-value metal recovery projects because these categories face similar problems: dense design, fast product turnover, difficult batteries, scarce materials, and rising repair expectations.
The first case pattern is modular design. Fairphone remains one of the clearest examples. Its products have been built around repairability, spare part access, longer software support, and more transparent material sourcing. The Fairphone 6 received a 10/10 repairability score from iFixit, with reviewers noting user-replaceable parts, limited adhesive, basic tool access, spare parts availability, and long support commitments. This does not mean every XR headset can copy a smartphone design. It does mean that repairability can be made measurable, tested, and visible to customers.
For XR, the lesson is direct. A headset should not bury its battery, speakers, face interface, charging port, head strap, lenses, and sensor modules behind destructive assembly steps. These parts face wear, hygiene issues, drops, sweat, and battery aging. If they are serviceable, the device can live longer. If they are fused, the whole unit becomes a recycling problem after one or two common failures.
The second case pattern is recycled material scaling. Apple’s progress shows how large electronics companies can set material-specific targets and report progress across product lines. Apple reported that 30% of the material in products shipped in 2025 came from recycled sources. It has also highlighted recycled rare earth elements, recycled cobalt, recycled lithium, recycled aluminum, recycled tin, recycled copper, and recycled gold across its reporting.
The lesson for XR is that “recycled content” should not be treated as one number. Headset makers should separate recycled aluminum in frames, recycled plastic in housings, recycled rare earths in magnets, recycled copper in charging parts, recycled tin in solder, recycled cobalt or lithium in batteries where certified supply exists, and recycled packaging fibers. This allows better procurement decisions and cleaner reporting. It also prevents vague recycled-content claims that do not show where the material actually sits in the product.
The third case pattern is repair access as a public benchmark. iFixit and similar teardown platforms have turned repairability into a visible consumer and media issue. Devices with glued batteries, soldered ports, hidden screws, fragile cables, and limited parts access now face public criticism. Even if the product sells well, poor repairability can damage sustainability claims. This matters for XR because headsets are expensive, personal, and often used in schools, training centers, hospitals, design studios, and enterprise fleets. Buyers will care about downtime, replacement cost, hygiene, and service access.
A headset with a replaceable face gasket, replaceable strap, replaceable battery, replaceable cable, replaceable lenses, replaceable speakers, and clear diagnostics has a stronger circularity story than one that depends on full-unit swaps. The KPI lesson is that repairability should be tested by people who were not on the original design team. If a trained technician cannot replace a common-failure part safely and quickly, the score should drop.
The fourth case pattern is certified purchasing. EPEAT and TCO Certified show how third-party standards influence enterprise buying. EPEAT is a global ecolabel for electronics and uses science-based criteria with independent third-party verification. TCO Certified focuses on areas such as climate, substances, circularity, and supply chain. These systems matter because many institutional buyers need proof before they include products in approved procurement lists.
XR is moving into the same procurement environment. Schools, hospitals, government agencies, defense contractors, universities, and large employers will increasingly ask for circularity evidence. A vendor that can show repairability scores, take-back coverage, refurbishment yield, recycled content, spare part availability, battery replacement process, and certified recycling routes will have a stronger procurement argument than a vendor with generic sustainability claims.
The fifth case pattern is high-value material recovery. The Royal Mint’s e-waste recovery project in the UK shows how valuable metals can be recovered from electronics at meaningful scale. Its facility was designed to process thousands of tonnes of circuit boards per year and recover gold, copper, silver, and palladium using technology intended to reduce the need for traditional high-heat processing.
For XR recycling, this is important because headsets contain small but valuable material streams. The economics are difficult at low volume, but become stronger when devices are sorted, documented, and processed through the right channels. Mixed shredding destroys value. Product-specific sorting protects value. A recycler that knows the product family, battery chemistry, board layout, magnet location, and material mix can recover more than a recycler receiving anonymous mixed electronics.
The sixth case pattern is rare earth supply resilience. Apple’s investment in MP Materials included a focus on rare earth magnets and recycling neodymium magnets from used electronics for use in Apple products. This points to a wider issue for XR: rare earth elements are not only a sustainability topic. They are a supply chain risk topic.
XR devices can depend on magnets, speakers, haptics, tracking systems, motors, cameras, and other components tied to critical minerals. Circularity KPIs should measure whether these components are identified, recoverable, and routed into suitable recovery systems. A company that can recover rare earth-bearing components has more supply resilience than one that treats every returned device as low-value scrap.
The seventh case pattern is product data. Digital Product Passports are becoming a major part of the EU product policy direction under ESPR. DPPs are intended to make product information available across the lifecycle, including composition, sustainability, and lifecycle-related data.
XR companies should treat this as a design requirement, not a compliance afterthought. A product passport-style record can support repair, resale, warranty recovery, recycling, and buyer trust. It can include part lists, materials, repair manuals, battery information, firmware reset steps, hazardous substance declarations, and refurbishment test procedures. This gives technicians and recyclers the information they need to make better decisions.
The eighth case pattern is circular business models. Enterprise XR deployments are a natural fit for leasing, managed device fleets, refurbishment, redeployment, and return guarantees. Consumer take-back programs often struggle because people forget, delay, resell informally, or keep old devices in drawers. Enterprise fleets are easier to track because units are assigned, managed, depreciated, and replaced on a schedule. That creates better data, stronger return rates, and more predictable refurbishment volume.
For example, a company leasing 5,000 headsets to training centers can design a planned return cycle. At month 18 or 24, devices return to a service hub, get graded, cleaned, repaired, redeployed, resold, harvested, or recycled. The KPI system can measure each step. This model gives circularity teams a controlled environment to prove recovery economics before expanding to consumer channels.
The ninth case pattern is the gap between public claims and verified results. Many electronics brands claim recycled content, responsible recycling, or product take-back. The stronger companies can show numbers by product, region, material, and outcome. They can separate units collected from units refurbished. They can separate materials processed from materials recovered. They can separate recycled input from closed-loop input. They can prove where devices went.
This is where XR brands can lead. The market is still young enough for better circularity systems to become a differentiator. A company that publishes device-level repair scores, return rates, refurbishment yields, spare part coverage, recycled content by material, and verified recovery rates will stand out. A company that waits until regulation forces disclosure will look reactive.
FAQs: Circularity KPI Edition
What are the most important circularity KPIs for XR devices?
The most important KPIs are repairability score, battery replacement time, spare part coverage, device return rate, refurbishment yield, harvested part reuse rate, true material recovery rate, recycled content input, landfill diversion rate, and verified downstream processing rate. For XR, hygiene-related KPIs should also be included because face cushions, head straps, lenses, and wearable contact surfaces affect whether a device can be redeployed.
How is a circularity KPI different from a recycling KPI?
A recycling KPI usually measures what happens after a product is discarded. A circularity KPI measures the full lifecycle. It includes design, sourcing, repair, collection, refurbishment, parts reuse, recycling, and reintegration of materials into new products. A device can have a recycling pathway and still perform poorly on circularity if it is hard to repair, hard to return, hard to refurbish, and made with little recycled content.
Should XR brands measure recycling by weight or by value?
They should measure both. Weight-based recycling is useful because it shows total mass diverted from landfill or disposal. Value-based recovery is also important because small components can contain high-value metals or critical materials. For example, circuit boards, magnets, batteries, copper parts, and aluminum frames may matter more than their weight suggests. A strong scorecard tracks recovery by material family, economic value, and verified destination.
What is a realistic return rate for XR devices?
There is no universal benchmark yet because XR take-back systems are less mature than smartphone collection systems. Enterprise fleets should aim much higher than consumer channels because devices are tracked and replaced on schedule. A consumer program may start with low double-digit returns, while a managed enterprise lease program can target much higher recovery if the contract requires return. The KPI should be tracked by channel, not averaged across all users.
What is a good refurbishment yield?
It depends on product design, customer behavior, age of returned devices, spare part availability, and diagnostic quality. For a well-designed enterprise XR fleet, a 50% to 70% refurbishable return pool may be possible once the program matures. For mixed consumer returns, the yield may be lower. The more important point is trend direction. If yield rises with each product generation, the KPI system is working.
How should companies measure repairability?
Repairability should be measured through real teardown and repair tests. Useful metrics include time to access the battery, time to replace common-failure parts, number of tools required, number of destructive steps, adhesive removal difficulty, availability of spare parts, quality of repair manuals, firmware reset process, and successful retest rate. Public repairability benchmarks, such as iFixit-style scoring and policy tools like repairability indexes, can help shape internal scoring.
Why is battery replacement such a major XR circularity KPI?
Batteries age faster than many other components. They can also create safety risks if swollen, damaged, or poorly handled. If a battery is glued under fragile parts, many devices may be scrapped even when displays, sensors, lenses, speakers, and frames still work. A replaceable battery can extend device life, improve refurbishment economics, and reduce waste.
How should recycled content be reported?
Recycled content should be reported by material type and source. Companies should separate post-consumer recycled content from post-industrial recycled content. They should also identify where the material appears in the product, such as aluminum frame, plastic housing, copper components, magnets, battery materials, circuit board metals, or packaging. A single recycled-content percentage is useful, but it is not enough.
What is the difference between recycled content and closed-loop content?
Recycled content can come from many sources. Closed-loop content comes from recovered material that re-enters the same or similar product system. For example, aluminum recovered from electronics and used again in electronic device housings is closer to closed-loop circularity than mixed recycled metal used in unrelated low-value applications. Closed-loop content is harder to achieve but stronger as a circularity metric.
How can XR companies avoid greenwashing in circularity reporting?
They should avoid vague claims such as “eco-friendly,” “recyclable,” or “sustainable” without proof. Strong reporting should show collection rate, refurbishment yield, reuse rate, recovery rate by material, downstream verification, recycled content by material, repair manual coverage, spare part availability, and product generation comparisons. If a device is only technically recyclable under rare conditions, the company should not present that as a real-world recycling success.
Do Digital Product Passports matter for XR circularity?
Yes. Product passport-style records can make repair, reuse, resale, recycling, and compliance easier. XR devices contain many material types and service-sensitive components. A DPP can identify battery chemistry, materials, part numbers, repair steps, firmware reset requirements, hazardous substances, and recycling instructions. Under the EU policy direction, better product data is becoming part of the future compliance landscape.
How often should circularity KPIs be reviewed?
Operational KPIs should be reviewed weekly. Product-level and supplier-level trends should be reviewed monthly. Executive circularity reporting should be reviewed quarterly. Annual reporting is useful for public disclosure, but it is too slow for product improvement. Circularity needs the same operating rhythm as quality, warranty, and supply chain management.
Who should own circularity KPIs?
No single team should own all of them. Design teams should own repairability and disassembly metrics. Procurement should own material and supplier metrics. Operations should own return and refurbishment metrics. Recycling partners should own recovery metrics. Sustainability should coordinate the system and reporting. Finance should connect circularity to cost, margin, risk, and lifecycle value.
Competitive Differentiation: Market Gaps and Upgrades
The XR market has a circularity gap. Product innovation has moved faster than product recovery. Hardware teams compete on display quality, field of view, weight, battery life, tracking accuracy, comfort, software, content, and enterprise integrations. Fewer brands compete clearly on repairability, refurbishment readiness, material recovery, or second-life deployment. That creates room for a strong circularity position.
The first market gap is repair visibility. Many buyers cannot easily tell whether an XR headset can be repaired, what parts are replaceable, how long parts will remain available, or whether the battery can be changed without damaging the device. This is a problem for schools, hospitals, warehouses, defense contractors, training providers, and enterprise IT teams because downtime and full-unit replacement raise costs. A brand that publishes clear repairability data can reduce buyer uncertainty.
The second market gap is spare part planning. Circularity fails when parts are unavailable. A product can be designed for repair, but if batteries, face interfaces, straps, lenses, controllers, cables, speakers, and charging ports are not available at fair prices, repair does not happen. XR brands should publish spare part availability periods, authorized repair pathways, and service-level targets for common parts. For enterprise buyers, spare part commitments can become a reason to choose one vendor over another.
The third market gap is hygiene-driven refurbishment. XR devices are personal contact devices. A laptop can be wiped down and redeployed. A headset needs a stricter process because it contacts the face and head. This creates a circularity barrier, but also a market opportunity. Brands that design replaceable facial interfaces, washable or recyclable straps, removable foam, easy lens cleaning, and sealed serviceable surfaces can improve redeployment rates. Refurbishment KPIs should include sanitation pass rate, cosmetic acceptance rate, replaceable contact-part coverage, and redeployment approval rate.
The fourth market gap is firmware and account lock recovery. A returned device may be physically usable but commercially blocked by firmware locks, account locks, device management profiles, missing ownership transfer, or failed factory reset. This can push otherwise valuable devices into parts harvesting or recycling. XR brands need clear secure reset processes for consumer and enterprise units. The KPI should track firmware reset success rate, locked-device rate, average unlock time, and percentage of devices lost to software barriers.
The fifth market gap is verified recycling depth. Many programs stop at “take-back available.” Buyers increasingly need to know what happens next. Were returned devices refurbished? Were parts reused? Were batteries handled by certified processors? Were circuit boards sent to high-value recovery? Were plastics recovered or rejected? Were materials exported? Were downstream partners audited? A brand that can answer these questions with verified numbers will have stronger ESG credibility.
The sixth market gap is material-specific recovery. XR brands should not report circularity only at device level. They should report by material and component class. Aluminum frames, copper circuits, rare earth magnets, batteries, circuit boards, plastics, optics, textiles, and packaging should each have their own targets. This gives engineers better feedback and gives buyers more useful information.
The seventh market gap is closed-loop sourcing. Many companies use recycled content where it is easiest, such as packaging or certain aluminum parts. The next upgrade is to identify material streams from returned devices and test their reintegration into new components. This will not be easy for every material. Plastics may face quality and additive challenges. Batteries require strict chemistry and safety controls. Rare earth magnets need advanced processing. But pilot programs can prove what is possible and build supply resilience.
The eighth market gap is enterprise circularity contracts. Most XR sales focus on device features, support, and software. Circularity can be written into contracts. Enterprise agreements can require return of all units, scheduled refresh cycles, minimum refurbishment attempts, secure data reset, certified recycling, parts reuse, and quarterly circularity reporting. This turns circularity into a commercial commitment. It also gives the manufacturer cleaner device recovery volume.
The ninth market gap is lifecycle cost reporting. Buyers often compare device prices without comparing repair cost, replacement cost, downtime, service access, return logistics, and end-of-life cost. XR vendors can stand out by publishing lifecycle cost models. A slightly more expensive headset may be cheaper over four years if it has replaceable parts, strong service coverage, high redeployment value, and lower disposal cost. Total cost of ownership is already a common business concept, and circularity metrics make it more complete for hardware purchasing.
The tenth market gap is public circularity benchmarking. XR brands should create product-level circularity scorecards that buyers can compare. A strong scorecard could show repairability score, battery replacement time, spare part coverage period, percentage of recycled content, return pathway coverage, refurbishment yield, verified recycling rate, material recovery rate, and product passport readiness. This would push the market toward proof instead of vague claims.
The strongest competitive upgrade is to make circularity part of the product promise. A circular XR product should be sold with a clear message: it is designed to last longer, easier to repair, easier to return, safer to refurbish, better documented, and better prepared for material recovery. That message matters to ESG teams, but it also matters to CFOs, procurement teams, IT managers, school districts, and enterprise operations leaders.
Conclusion
Circularity KPIs are becoming one of the most important management tools for XR and emerging electronics. The industry cannot rely on broad sustainability language while devices become more complex, more material-intensive, and harder to recover. The world already generated 62 million tonnes of e-waste in 2022, and documented collection and recycling covered only 22.3% of that mass. That gap is too large for generic recycling claims.
XR devices need a more complete measurement system. They need KPIs that start in product design and continue through sourcing, manufacturing, sales, returns, refurbishment, parts harvesting, recycling, and recycled material reintegration. The best circularity programs do not ask, “Did we recycle this device?” They ask, “Did we design this device so it could stay useful for longer, return to us cleanly, get repaired economically, provide reusable parts, recover valuable materials, and improve the next product generation?”
That shift changes everything. Repairability becomes a design requirement. Spare parts become a strategic asset. Product data becomes a recovery tool. Firmware reset becomes a circularity KPI. Refurbishment yield becomes a profit signal. Recycling quality becomes a verified material outcome. Recycled content becomes a sourcing strategy. Take-back becomes a business model.
The regulatory direction is clear. The EU’s Ecodesign for Sustainable Products Regulation, Digital Product Passport direction, and repair-focused rules point toward a market where product sustainability must be documented, not claimed. Enterprise buyers are moving in the same direction. They want proof of repairability, responsible sourcing, lifecycle value, take-back coverage, and verified recovery.
The commercial direction is also clear. Companies that recover devices can recover value. They can reduce warranty waste, harvest parts, resell refurbished units, support leasing models, lower dependency on virgin materials, improve supply resilience, and build trust with buyers. Companies that do not measure circularity will lose visibility into product failures, material losses, compliance exposure, and secondary-market value.
The next generation of XR products should be judged by more than resolution, latency, comfort, and compute power. It should also be judged by how fast the battery can be replaced, how many parts can be reused, how much recycled content is inside, how many units return after first use, how many are refurbished, how much material is recovered, and how much of that material returns to productive use.
Circularity KPIs are not paperwork. They are the control system for better electronics. For XR brands, they can reduce waste, protect materials, improve margins, support compliance, and create products that remain useful after the first owner is done with them. The companies that build these metrics into design and operations now will be better prepared for 2030 than those that wait for regulation, buyer pressure, or material shortages to force the change.
Connect
Your trusted partner for scrap metal procurement.
CONTACT
About
haroon@tdcventures.com
+1-307-655-7593
© 2025. All rights reserved.
NEWSLETTER