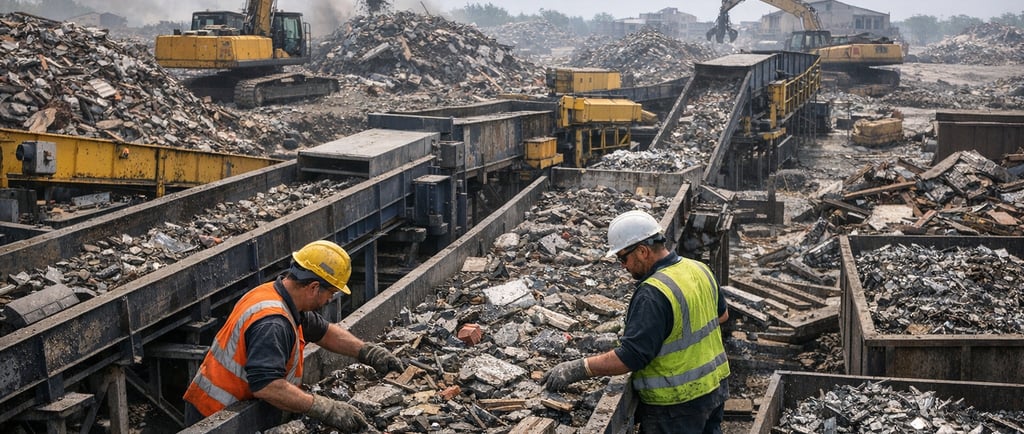
Disaster Debris to Materials: Sorting Lines that Work
Discover how advanced disaster debris sorting lines turn crisis waste into valuable recycled metals, accelerating climate-resilient infrastructure and circular recovery.
CLIMATE-RESILIENT INFRASTRUCTURE & CIRCULAR MATERIALS
Disaster Debris Sorting Lines: Why Resilience and Circularity Must Align
Each year, the world witnesses a growing number of natural disasters—from hurricanes battering coastlines to wildfires engulfing neighborhoods and earthquakes shaking cities to their foundations. Estimates by the UN Environment Programme show disasters generate over 100 million tons of waste annually, underscoring the magnitude of the problem. Of that, metals and construction materials are among the most valuable and reusable assets.
Aligning Resilience with Circular Principles
Increasingly, resilience and circularity are converging as best practices for modern infrastructure. Communities that can rapidly reuse assets, particularly metals, cut dependence on fragile global supply chains and recover more quickly. Studies from the Resilient Cities Network indicate that cities with robust, locally integrated material recovery systems often return critical services 30–50% sooner compared to those reliant on virgin-resource imports.
Why this matters:
Business Continuity: The ability for construction, utility, and transportation sectors to pivot immediately post-disaster improves both safety and economic speed.
Carbon Impact: Circular strategies via recycled metals reduce CO₂ emissions, supporting climate adaptation and sustainability targets. For instance, recycled steel production uses 25% of the energy required for primary steelmaking.
Economic Multiplier: Circular debris management stimulates local jobs in sorting, transport, and remanufacturing—injecting millions into local economies during recovery.
Ultimately, aligning sorting line efficiency with resilience and circularity becomes a competitive edge for both disaster response agencies and regional contractors.
2. Defining the Challenge: From Chaos to Circular Asset
The Scale of the Challenge
Natural disasters leave absolute chaos in their wake—not just in human terms, but also in the volume and heterogeneity of debris. The 2017 Hurricane Harvey, for example, left Houston with over 8 million cubic yards of debris. Without efficient systems, much of this material, especially metals, ends up in landfills, representing both an environmental liability and a squandered opportunity.
What’s at Stake: Facts and Risks
Metals Contamination: A study by the Institute of Scrap Recycling Industries (ISRI) found that a single kilogram of plastic, paint, or oil mixed with a ton of recycled steel can render entire batches non-recyclable—driving up costs and undermining infrastructure integrity.
Regulatory Compliance: FEMA debris management guidelines require clear documentation, hazardous sorting, and contamination controls. Failing these standards jeopardizes federal funding and future contracts.
Logistical Bottlenecks: Poorly designed sorting lines often result in pileup, manual rework, and excessive downtime—slowing recovery by days or weeks.
Circular Asset Potential
Well-optimized processes can increase recovery rates dramatically. Japan’s circular response to the 2011 Tōhoku earthquake diverted over 72% of disaster debris into secondary uses—mainly recycled metals for bridges and transportation networks—demonstrating resilience and sustainability in action.
3. Key Concepts: Resilience, Low Carbon, and Infrastructure Materials
Understanding Resilience in Infrastructure
Resilience now means more than “bouncing back”—it’s about future-proofing. Every piece of metal recovered and placed directly into emergency rebuilding not only restores function but builds with climate risk and supply chain vulnerability in mind. The Rockefeller Foundation’s City Resilience Framework ranks “resourceful recovery” as a core metric—where cities score higher if they reuse local materials.
Low-Carbon Solutions in Action
Globally, the steel industry accounts for roughly 8% of total CO₂ emissions. Shifting even a fraction of post-disaster supply to scrap-based channels can substantially reduce emissions. According to the World Steel Association, using recycled steel reduces CO₂ by 1.5 tons per ton produced, and similar numbers apply to aluminum.
Fact: In North America, average recycled steel content in construction is about 60%, but post-disaster programs with optimized sorting lines can drive this closer to 90%, accelerating carbon reduction.
Core Sorting Line Functions
A modern materials recovery facility (MRF) is more than conveyors and magnets—it’s a sophisticated system combining sensor technology (like XRF), advanced data capture, and skilled manual labor, all working to yield high-value, specification-grade recycled metals.
Ferrous Metals: Steel, iron (for construction frames, bridges)
Non-Ferrous Metals: Aluminum, copper (for utilities, transport lines)
Contamination Thresholds: Must meet ASTM or local government reqs—often <1% non-metal content by mass for structural reuse
Holding these components together is a relentless focus on resilient operations and circularity—enabling real-time, nimble responses to disaster recovery needs.
4. Core Framework: Recycled Metals for Disaster Recovery
Sorting post-disaster debris is inherently complex—requiring agility, adaptability, and rigorous controls. Industry leaders deploy a multilayered framework, balancing mechanical throughput with contamination risk management.
Stepwise Framework for Material Recovery
1. Inbound Triage
Implement rapid assessment using both trained staff and portable hazard sensors.
Deploy AI-driven image capture to flag hazardous or high-value material in real time, reducing risk and optimizing prioritization.
2. Primary Mechanical Separation
Use high-capacity shredders and magnets to separate ferrous from non-ferrous streams.
Integrate air classifiers and drum screens to deal with lightweight contaminants common post-windstorm.
3. Secondary Manual QA
Employ multi-shift teams for hand-picking and quality control—proven to lower contamination rates by 30–40% compared to mechanical-only lines (according to Waste Management Journal).
4. Dynamic Contamination Controls
Harness sensor technology—XRF for precise alloy sorting, NIR scanners for organic/inorganic identification.
Use inline oil and paint detectors. Real-time data feeds empower line supervisors to re-route suspicious batches instantly.
5. Output Certification
Deploy digital taggers and cloud platforms for full traceability—meeting both infrastructure client specs and regulatory demands.
Link batch certification to supplier contracts: Only “clean” metal batches are released for infrastructure supply.
Case in Action: Worked Example
Let’s revisit the post-hurricane MRF scenario:
Debris Intake: 25,000 tons in 7 days
Line Layout: Multistream (3 in, 2 metal, 1 QA)
Throughput: Robust data shows top lines process 1,000+ tons/day under surge, with contamination rework kept under 5% due to strict manual QA and data-driven sampling.
Outcomes: 96% pass rate on contamination; metals supply released within 5 days, supporting emergency bridge replacement in record time.
Comparison to Traditional Practices
Without advanced sorting lines, metal recovery seldom exceeds 10% of total debris, with contamination rejection rates over 12%. Optimized frameworks double yield, slashing waste and delays.
5. Step-by-Step Process: Sorting Line Design and Operation
1. Hazard Assessment
Use both visual and electronic (VOC, asbestos sensors) checks.
Segregate hazardous waste immediately, flagging with RFID tags for isolation and specialist removal.
2. Pre-Sort Staging
Employ loaders and telehandlers to move oversized debris, reducing manual risk and optimizing line flow.
Fast-track obvious metals to primary sort.
3. Primary Mechanical Sort
Automated feed rate adjusts based on sensor analysis (>15% metal content increases conveyor speed, <5% slows feed for manual).
Integrated alarms indicate oversized or hazardous items for intervention.
4. Manual QA Line
Staff rotate periodically to maintain alertness—studies show rotation every two hours reduces error rates by 20%.
Assign additional staff during anticipated input surges (e.g., after storm peaks).
5. Metal Density Sort
Utilize eddy current separators calibrated for disaster stream variability.
Maintain maintenance logs—regular calibration is key for optimal recovery.
6. Batch Sampling
Institute statistical spot checks—sample size determined by input variability and tonnage.
Employ quick field kits for oil/petroleum residues; positives flagged for batch rework.
7. Digital Tagging
Digital photo, barcode scans for each batch; metadata includes location, staff on shift, contamination check results.
Use custom cloud dashboards for live oversight.
8. Output Certification
Only metals achieving spec-grade purity (e.g., <1% non-metal) enter certified inventory.
Failures documented, reprocessed, and root causes analyzed weekly.
9. Storage and Transport
Designated, secure zones organize output by material and destination, expediting contractor pickup.
Partner with local logistics firms—keeps jobs and value local.
10. Daily Line Audit
Conduct end-of-shift reviews using digital and manual logs.
Cross-check QA, equipment alarms, and downtime against KPIs.
Decision Tree Diagram Reference
Quick actionable checks at each stage, with immediate escalation for out-of-spec conditions, ensure consistent quality. Move batches forward only upon passing each layer of scrutiny—delivering confidence to both government clients and contractors.
6. Measurement and QA: Metrics, Dashboards, and Controls
Measurement isn’t just about compliance—it’s about driving continuous improvement. Smart facilities set ambitious KPIs and leverage live dashboards that combine IoT sensors, manual input, and automated alerts.
Weekly Metrics (Critical Benchmarks)
Throughput: Target 1,000+ tons/day; real-time monitoring helps identify slowdowns instantly.
Contamination Rate: Gold standard is <5% failed batches; leaders in the field achieve 3–4% by doubling down on manual QA and rapid feedback.
Downtime: Less than 1 hour/day ensures capacity for surges—predictive maintenance schedules key machines accordingly.
Yield Rate: >15% metals recovery is considered world-class.
Staff QA Compliance: Over 98% audit pass recommended; non-compliance triggers retraining modules.
Monthly Metrics (Strategic Oversight)
Certified Output to Infrastructure: Tonnes of metal funneled into public works—directly ties sorting success to civic outcomes.
CO₂ Avoided: Quantify and document carbon savings for ESG reports; use standard conversion factors for recycled vs. primary metals.
Safety Incident Tracking: Zero-incident months are the goal; feeds into insurance and contract compliance.
Average Intake to Output Time: Benchmark days from arrival to release—top performers achieve <3 days.
Data-Driven Controls
Investing in an integrated, cloud-based dashboard means every manager sees performance, real-time exceptions, and historical trends at a glance. Patterns in contamination or downtime inform process tweaks or staff retraining, creating a virtuous cycle of learning.
Actionable tip: Facilities publishing regular KPI scorecards gain trust with municipalities and insurance partners—often leading to contract renewals or expansions.
Surge capacity, siting, and how you keep the line moving when the disaster is still unfolding
If your sorting line design assumes “normal” inbound behavior, it will fail during a real event. Disaster streams are not steady. They spike. They mix categories that are normally separated across different waste routes. They also arrive with unpredictable moisture content, salt exposure, and embedded hazards.
A useful mental model is to treat disaster debris like an emergency supply chain with three competing objectives that conflict unless you design for them upfront: speed, safety, and specification purity. Speed is about clearing rights-of-way and restoring services. Safety is about controlling asbestos, fuels, pressurized cylinders, batteries, sharps, and unstable loads. Specification purity is about making output usable, not merely diverted.
Start with siting strategy.
Most jurisdictions end up using a network, not a single site. You need at least three layers.
First, curbside or collection-point segregation where feasible, because it reduces cross-contamination before it compounds. FEMA’s debris guidance and monitoring materials repeatedly emphasize segregation, documentation, and proper handling for hazardous components because mixing creates compliance and reimbursement problems.
Second, temporary debris management sites that can buffer the surge and create staged “feedstock lanes” for the line. Third, a central processing site or contracted MRF capacity that can run multiple shifts.
Capacity planning should be expressed in “days of surge coverage,” not annual tonnage.
The Great East Japan Earthquake generated disaster waste on the order of tens of millions of tons. Even much smaller events can overwhelm local disposal and processing for weeks. Your design goal is to avoid the classic failure mode where mixed piles grow faster than they can be processed, then sit long enough to degrade, leach, or become a safety hazard.
Practical surge design choices that consistently matter
Feedstock lanes that match reality. Create lanes by risk and by value, not by idealized categories. One lane for obvious clean ferrous, one for mixed C&D with high metal probability, one for white goods and appliances, one for suspected hazardous or unknowns, and one for fines and small debris.
Buffering that protects your line. A line that stops for every surprise item becomes a manual rework facility. Use pre-sort buffering so the line never runs “starved” or “jammed.”
Redundancy in critical separation. Magnets, eddy current separators, and screening must have bypass routes. During surge, you will run “good enough” routing for speed, then tighten purity with secondary passes.
Weather and moisture adaptation. Wet debris behaves differently on screens and conveyors. Your operating plan should include rainy-day settings for feed rates and screening.
Compliance and reimbursement, the paperwork is part of the process, not an admin add-on
Many operators treat documentation as something you do after the material moves. That is a mistake in disaster settings. Documentation determines whether a jurisdiction gets reimbursed, whether contractors get paid, and whether the recovered output can be sold into infrastructure supply.
FEMA’s public assistance materials and debris monitoring guidance put strong emphasis on monitoring, documentation, and correct handling of hazardous wastes, including documenting improper segregation. EPA’s disaster debris planning guidance reinforces that debris management decisions must be planned, staged, and aligned with disposal and treatment options that may be constrained for long periods after an event.
In practice, you need a “chain of custody” mindset for disaster debris, especially when you want to claim circular outcomes and deliver material into public works. Your batch tag is not just inventory control. It becomes evidence.
What good looks like in the field
A unique batch identity from the first controlled point, with location and date-time stamps.
Photos at inbound, at key separation points, and at outbound.
A simple hazard flagging system that can be used by loader operators and line supervisors, not just compliance staff.
Disposition codes that match local regulatory categories and contract categories, so you do not spend months reconciling mismatched systems.
An exception workflow that is fast. When a batch fails a contamination check or a hazard is found, you need a standard reroute path, not a discussion.
A tight documentation system reduces disputes and accelerates payments. It also improves operating outcomes. Every time you can trace a contamination pattern to a specific source area, contractor, or time window, you can fix the upstream behavior.
Workforce, safety, and how to prevent injury while keeping throughput high
Disaster debris is harder than normal scrap. Loads are unstable. Hidden sharps increase cuts. Batteries and pressurized cylinders introduce fire and blast hazards. Vehicles and heavy equipment operate in tight spaces while new staff rotate in.
OSHA’s scrap recycling guidance is a strong baseline for understanding hazards and controls in scrap operations, and it becomes even more relevant during disaster surge conditions.
Design the labor model around three realities.
First, surge staffing. You will add people quickly, including less experienced workers.
Second, fatigue. Long shifts in chaotic environments degrade quality control.
Third, task specialization. A mixed crew with unclear roles produces inconsistent sorting and higher injury risk.
Build safety into the line design, not just training
Clear line-of-sight and physical separation between pedestrians and mobile equipment lanes.
Lockout and tagout discipline for jams and maintenance, even during surge.
Dedicated “hazard intercept” positions before shredders and high-risk equipment.
Fire detection and suppression planning for lithium batteries and smoldering loads.
Quality control and safety reinforce each other. A line that is constantly stopping for surprises is a line where people take shortcuts. A line with stable flow is easier to supervise and safer to operate.
Offtake and end markets, how recovered metals become rebuilding inputs fast
A sorting line is only as good as its offtake. If you cannot move output into buyers with clear specs, your yard becomes a storage site and your cash cycle collapses.
This matters because disaster waste volumes are large and fast. Japan’s post-2011 earthquake programs reported high recycling rates for debris, with one Ministry of the Environment presentation citing 72% for debris and 96% for sediments, which shows what is possible when processing capacity and offtake pathways are engineered in parallel.
Your best strategy is to pre-build “spec pathways” for your main output classes.
Ferrous pathway: clean ferrous to shredder feed or directly to mills, and lower-grade ferrous to secondary processing. The key is consistent chemistry and low non-metal carryover.
Non-ferrous pathway: aluminum, copper, and mixed Zorba style streams require tighter controls and often benefit from sensor assistance or secondary sorting to improve value.
Appliances and white goods: remove refrigerants and hazardous components through certified processes, then route metals.
Rebar and structural steel recovery: when feasible, prioritize larger, cleaner structural pieces because they offer faster route-to-value with less processing.
Also, be honest about what “infrastructure reuse” means. It usually means “recycled into new infrastructure products,” not direct reuse of the same piece, unless you are dealing with salvageable beams or components with known provenance. Your blog will become more trustworthy if you make this distinction explicit.
Procurement and contract models, you win before the disaster by writing better agreements
A recurring failure in debris recovery is that procurement is activated late and written for disposal, not recovery. That locks you into landfill-heavy routes and makes it hard to justify the extra steps needed for spec-grade output.
A better model is to pre-negotiate surge terms and quality gates.
Pre-event contracts for temporary debris sites, equipment rental, transport, and processing capacity.
Pricing schedules that include contamination thresholds and rework rules, so disputes do not stall operations.
Clear incentives tied to verified recovery outcomes, not just tonnage moved.
If you want to connect this to climate and ESG reporting, tie it to recognized emissions realities. Steel accounts for about 7%–8% of global anthropogenic greenhouse gas emissions, so procurement standards that favor high scrap utilization and traceable recycled content can carry measurable climate value.
This is also where public agencies are changing. Many are being asked to prove outcomes beyond “cleanup completed,” including carbon impacts and circularity outcomes. If your sorting line program can produce auditable evidence, it becomes easier to renew contracts and expand scope.
Technology roadmap, what changes in the next five years and what you should design for now
Technology will not replace good operations, but it can reduce variance, tighten quality, and improve traceability.
Expect three shifts.
First, stronger expectations on traceability. Public works owners and major contractors increasingly want credible material origin and processing evidence. The simplest near-term path is not a complex blockchain story. It is consistent batch IDs, time-stamped photo evidence, and test results stored in a system that can be audited.
Second, more pressure on carbon accounting and reporting. Steel’s climate impact share is large, and reporting frameworks are becoming more common across infrastructure and construction. You will want a repeatable method for calculating avoided emissions from recycled metal routes, with conservative assumptions.
Third, better handling of “problem materials.” Batteries, composites, and mixed-material products are rising in normal waste streams and surge into disaster streams. EPA’s disaster debris planning materials emphasize that management options may be constrained and that planning should anticipate long storage or limited treatment capacity, which becomes more likely as material complexity increases.
If you are choosing equipment, favor flexibility and maintainability over theoretical peak performance. Disaster debris changes batch to batch, and equipment that cannot be tuned quickly becomes a bottleneck.
Toolkits
Toolkit 1, Rapid setup checklist for a disaster debris metals recovery line
Before the first truck arrives, you need an activation plan. Use this as your minimum viable setup.
Confirm your site layout, traffic flow, and separation between pedestrians and equipment.
Create feedstock lanes by risk and value, not ideal categories.
Set up hazard intercept positions and a hard rule for stopping items headed to shredders.
Define your batch ID scheme, photo points, and the minimum metadata you must capture.
Align your disposition codes with your contract and with agency reporting needs, so records match from day one.
Train monitors and supervisors on what must be documented, especially hazardous segregation issues, consistent with FEMA debris monitoring expectations.
Toolkit 2, QA sampling and contamination response playbook
Define your acceptance thresholds by output class.
Set a sampling cadence tied to inbound variability, not only to tonnage.
When a batch fails, route it through a standard rework loop, log the reason, and tag the upstream source.
Hold weekly root-cause reviews and implement one upstream control each week, such as tighter curbside segregation guidance or contractor feedback.
Toolkit 3, Documentation pack that speeds reimbursement and reduces disputes
A one-page batch record template with ID, source zone, date-time, photos, hazard flags, and disposition.
A monitor log aligned to FEMA expectations for observation and documentation of debris operations, including how improper segregation is recorded.
A daily production and downtime log that ties to invoicing categories.
An exception log for hazards, rejected loads, and rework.
Toolkit 4, Carbon and circular reporting pack that infrastructure owners will actually use
Start with conservative accounting. Use published steel emissions context as the justification for why recovered scrap matters, then apply consistent conversion factors and disclose your assumptions.
Report “tons recovered by class,” “tons certified to buyer specs,” “days from intake to outbound,” and “rework rate.”
Keep evidence attached. Batch IDs, photos, and test results should be easily retrievable for audits.
Conclusion, what a world-class reference should leave the reader with
Disaster debris sorting lines succeed when they are designed as an emergency materials supply chain. The work is not only to move waste out of sight. The work is to recover metals and other materials fast enough, clean enough, and safely enough that they can re-enter construction and infrastructure supply while the community is rebuilding.
Real disasters show the scale. Harvey created debris mountains measured in millions of cubic yards. Japan’s 2011 event produced disaster waste on the order of tens of millions of tons, and the national response shows how recovery performance can be measured and improved. The climate context makes the materials pathway even more important, because steel’s share of global emissions is significant and recovery programs can feed scrap-based production routes that reduce demand for primary production.
Connect
Your trusted partner for scrap metal procurement.
CONTACT
About
haroon@tdcventures.com
+1-307-655-7593
© 2025. All rights reserved.
NEWSLETTER