E-Waste Streams: What’s Really Recoverable at Scale
Discover which e-waste materials are truly recoverable at scale. Explore market drivers, scenario analysis, and actionable strategies for scrap buyers, sellers, and recyclers.
SUSTAINABLE METALS & RECYCLING INNOVATIONS
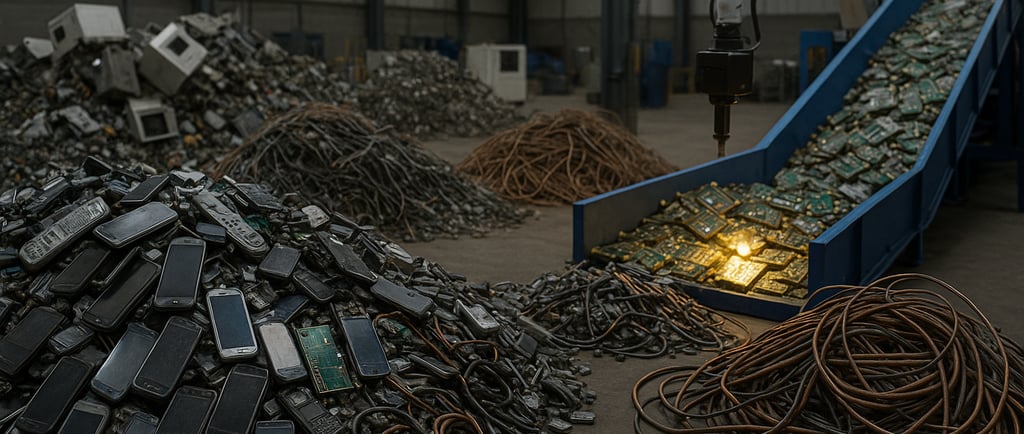
The global surge in electronic consumption has fundamentally reshaped our connection not only to innovative technology but also to the waste it leaves behind. Electronic waste—or e-waste—now stands as the fastest-growing waste stream in the world. According to the Global E-waste Statistics Partnership, in 2019 alone, the world generated 53.6 million metric tonnes of e-waste. By 2030, this figure is projected to soar to 74.7 million tonnes, reflecting a compound annual growth rate that outpaces most other types of waste.
While the environmental and economic promise of e-waste recycling is widely championed, a key question confronts manufacturers, recyclers, policymakers, and investors alike: What portion of e-waste is truly recoverable at scale, and which market dynamics shape what gets recovered? In this in-depth analysis, we’ll dive into the material composition and value of different e-waste streams, identify the drivers shaping recoverable content, evaluate market-ready and future scenarios, and finish with actionable insights for scrap buyers and sellers.
Understanding E-Waste Streams: Types, Material Value, and Recovery Realities
Comprehending recoverability hinges on performing a granular breakdown of e-waste into its major categories, each with unique characteristics and material yields:
Key E-Waste Streams
Consumer Electronics: Smartphones, laptops, desktop computers, tablets, televisions, game consoles, and smart home devices. This segment often contains high-value metals, but rapidly changing designs and miniaturization complicate dismantling and recovery.
IT & Telecom Equipment: Servers, hard drives, routers, switches, and data center components. Dense with printed circuit boards, these products often command a premium per tonne for gold, silver, and palladium.
Large Household Appliances: Refrigerators, washing machines, dryers, air conditioners, and dishwashers. These are typically easier to disassemble at scale thanks to their size, with substantial recoverable iron, copper, and aluminum.
Small Domestic Devices: Kitchen gadgets, toasters, coffee makers, personal care appliances. Individually, their material value is low, but their ubiquity and collective volume make them significant contributors to overall e-waste flows.
Specialized Industrial Electronics: Medical imaging systems, automotive electronics, and industrial control systems. These contain diverse and sometimes hazardous materials; proper recovery can prevent environmental harm while securing rare specialty metals.
Material Value by Stream
Each stream differs not only in volume but also in the concentration and diversity of recoverable materials:
Base Metals: Core to the electronics industry and easily monetizable at large scale, including copper (essential for wiring and circuits), aluminum (frames, heat sinks), and steel (casings).
Precious Metals: Gold, silver, palladium, and platinum are found chiefly in printed circuit boards, connectors, and microchips. A single tonne of smartphones can yield up to 350 grams of gold versus just 1-6 grams per tonne of gold ore—a striking economic incentive for formal recyclers.
Specialty & Critical Metals: Lithium (batteries), cobalt (batteries, capacitors), rare earth elements such as neodymium (used in speakers, motors), tantalum (in capacitors), and indium (touchscreens). These are subject to complex geopolitical and environmental dynamics.
But real-world recovery is not merely a matter of what’s inside a device. Recoverability is constrained by device design—miniaturized, glued, or multi-layered assemblies can make extraction more labor-intensive and costly, sometimes leading to lower yields or, in the worst cases, forfeited value.
Case Study: Smartphone Recycling
A contemporary smartphone contains about 40-60 elements from the periodic table. According to Umicore, one of the world’s largest precious metal refiners, recycling one million smartphones can recover nearly 16 tonnes of copper, 350 kg of silver, 34 kg of gold, and 15 kg of palladium. However, only a fraction of these devices enter formal recycling streams due to improper collection—a critical bottleneck for industry-wide scalability.
Market Drivers: The Economic and Regulatory Imperatives Shaping E-Waste Recovery
The engines pulling e-waste recovery forward encompass powerful macroeconomic trends, supply chain realities, policy pressure, and shifting consumer expectations.
1. Raw Material Demand & Price Volatility
Demand Acceleration
Tech proliferation isn’t slowing. Globally, the electronics and automotive sectors have stoked relentless demand for key metals. The electric vehicle (EV) boom, for instance, has driven exponential increases in demand for lithium, cobalt, and copper—by 2030, global lithium demand is expected to be five times what it was in 2020 (IEA, 2023).
Price Fluctuations & Supply Risks
Mineral price volatility is another driver that fuels recovery efforts. The 2021-2022 supply disruptions sent copper and lithium prices to historic highs—benchmark lithium carbonate surged fivefold over 18 months, and copper breached $10,000/tonne. Such price spikes make secondary sourcing from urban mines (e-waste) increasingly attractive, especially as geopolitical risks threaten traditional supply lines.
2. Scrapping Flows & Lifecycle Reduction
Shortening Device Lifespans
Fast innovation, consumer appetite for the latest models, and even planned obsolescence have slashed the average lifespan of electronics. Smartphones, once used for four years or more, now typically last less than three years. Laundry machines and refrigerators increasingly feature electronics that may fail before mechanical parts wear out.
"Density Dividend" In Modern Devices
Paradoxically, newer electronics pack more value per kilogram (thanks to denser circuitry and advanced batteries), but intricate designs and the trend toward miniaturized components make them harder to process. For example, Apple’s MacBook Air is assembled with proprietary screws and glued-in batteries, complicating cost-effective recycling but yielding higher concentrations of rare metals.
3. Regulatory Pressure and Producer Responsibility
Extended Producer Responsibility (EPR)
Europe leads the way. Under the WEEE Directive, manufacturers must finance the collection and proper recycling of their products. China, India, the United States, and many developing economies are following suit with their own EPR frameworks. Notably, the EU is now moving toward mandating minimum recycled content for new electronics.
Enforcement and Impact
Where regulation is well-enforced, collection rates—and the quality of recovered materials—are markedly higher. In Switzerland, for example, the government-backed recycling system achieves an e-waste collection rate exceeding 75%. Conversely, weak enforcement leads to informal processing, environmental hazards, and value leakage.
4. Consumer and Corporate Sustainability Initiatives
Brand Reputation and ESG
Sustainability is no longer an afterthought for global brands—it’s an operational imperative. Apple, Samsung, and Dell tout ambitions for closed-loop manufacturing, aiming to feed more recycled content into new products every year. Investors and rating agencies now assess ESG performance, directly influencing capital allocation.
Impact on End Markets
Sustainability-conscious consumers push for more recycled content and ask for transparency in sourcing. This shift has real economic impact: recycled metals increasingly fetch a price premium—a trend most visible in high-profile products touting sustainability as a selling point, such as smartphones, EVs, and solar energy equipment.
Scenario Analysis: Recoverability Realities at Scale
Despite the significant theoretical value embedded in e-waste, the path from discarded device to recycled commodity is fraught with both opportunities and challenges. Let's unpack current state realities and projected trends:
Theoretical Recovery Potential
Quantitative Perspective
Global e-waste formal collection remains low. The UN reports that less than 20% of all e-waste is properly collected and processed through formal channels, halting billions of dollars’ worth of metals from re-entering the supply chain.
Material Recovery Yields
Base Metals (Copper, Aluminum, Steel): Industrial-scale smelters can reclaim 85-95% of these metals from appliances and devices, representing the economic backbone of e-waste recycling.
Precious Metals: Technologically advanced facilities boast recovery rates between 70-90% using smelting and selective leaching.
Plastics and Mixed Materials: Non-metals lag far behind. Less than 25% of plastics are typically reclaimed, due to contamination, poor segregation, and polymer complexity. Rare earth elements, while technically recoverable, are so diffuse and chemically complex that economically viable extraction is achieved only in pilot projects or via specialized proprietary processes.
Case Study: Urban Mining in Japan
Ahead of the 2020 Olympics, Japan launched an ambitious program to collect over six million used mobile phones and other small electronics. The initiative provided all Olympic medals—almost 5,000 units—exclusively from recovered metals. This high-profile project demonstrated the potential of coordinated, high-participation e-waste collection. However, achieving comparable scales globally still contends with massive informal recycling and consumer hoarding.
System Limitations and Losses
Logistical Barriers: An estimated 54-70% of e-waste worldwide remains uncollected or handled through informal channels where valuable metals are burned off, released into the environment, or simply lost.
Design for Disassembly: Many electronics are not designed with end-of-life recovery in mind. Soldered or glued batteries, intricate multi-layer boards, and miniaturized components increase extraction cost and lower the yield.
Economic Imbalance: Recovery for some metals is not cost-competitive: Tantalum capacitors, lithium cells, and rare earths often require bespoke processes, high energy use, or new technology to extract profitably.
Industry Insight
Enabling large-scale recovery of rare earth metals (like neodymium or dysprosium from hard disk drives and speakers) remains a technical grail. While start-ups and research programs proliferate—from Finnish company Fortum’s hydrometallurgical breakthroughs to university-led green leaching projects—mainstream recycling is still years from fully commercializing these processes.
Part 2: Economic Drivers, Pricing, Trends and Practical Takeaways
In Part 1 we looked at what sits inside different e-waste streams and what is technically recoverable. The missing piece is the money. Which flows actually pay, who carries which risk, and how coming policy and technology shifts will change your margin stack.
If you are buying, selling, or processing e-waste at scale, you need to understand both the physical and the financial recovery. This section walks through the economics, pricing logic, regional patterns, emerging processes, and then finishes with a practical playbook you can apply in your own contracts and plant decisions.
The Economics Behind E-Waste Recovery
1.1 The global value pool
The newest Global E-waste Monitor estimated that the world generated about 62 million tonnes of e-waste in 2022, roughly 7.8 kilograms per person. Only around 22 percent of that was formally collected and processed. That flow contained about 31 million tonnes of metals and 17 million tonnes of plastics, with the raw material content valued at about 91 billion US dollars. Of that amount, only about 19 billion US dollars was actually recovered through sound recycling. E-Waste Monitor+1
That gap is your real opportunity and also your main constraint. The value is not evenly spread. It concentrates in:
Printed circuit boards, connectors, and high-grade assemblies
Lithium-ion and other high energy density batteries
Copper rich wiring, motors, and compressors
Heavy equipment and large appliances with thick copper coils and steel bodies
At the device level, recent studies suggest that recovered metals from one kilogram of smartphone bodies are worth around 13 US dollars, and metals in one kilogram of smartphone batteries around 11 US dollars at current refined prices. In those phone bodies, gold makes up more than 80 percent of the recovered value, even though its mass share is tiny. ScienceDirect
Those numbers show why serious recyclers fight for high-grade boards and batteries and treat low-grade mixed small appliances as a volume game.
1.2 Cost structure: where money leaks out
For a recycler or integrated processor, costs cluster in four buckets:
Collection and logistics
Pre-processing (sorting, dismantling, shredding, safety handling)
Metal recovery and refining
Compliance, permits, and overhead
Collection and logistics can easily consume 25 to 40 percent of gross metal value for low value, low density streams such as mixed small WEEE. Collection is cheaper for large, clearly identifiable units like fridges and washing machines, which are bulky but easy to target.
Pre-processing adds another 20 to 30 percent of value. Manual dismantling is labor intensive but gives cleaner fractions and higher yields on boards, copper, and aluminum. Shredding is faster but, if done carelessly, causes cross contamination and value loss.
On the recovery side, recent work on integrated WEEE plants that combine mechanical pre-processing with hydrometallurgy and pyrometallurgy reports metal recovery efficiencies above 90 percent for many valuable metals and project returns around 25 to 30 percent when plants are sized and fed correctly. ScienceDirect The catch is that these results assume consistent feed, strong technical control, and reasonable power prices.
Compliance costs vary by region but are never zero. Permits, monitoring, worker safety, and reporting can take 5 to 15 percent of gross margin. Where environmental standards are strict, these costs rise, but so does the long term licence to operate.
1.3 Why grade and scale decide everything
Two factors dominate whether a stream makes economic sense.
First, metal grade. As the earlier smartphone example shows, streams with dense circuit content or cobalt rich batteries can hold ten to twenty times more value per kilogram than mixed plastic rich scrap. For many processors, it is more profitable to handle a few hundred tonnes of high-grade boards than thousands of tonnes of low-grade shred.
Second, scale. Metal recovery technology typically needs steady tonnage and composition. A plant might reach efficient operation thresholds at 10,000 to 30,000 tonnes per year of boards and high-value components, but need far more if it also handles large appliances and mixed WEEE. Below those levels, fixed costs crush margins.
As a buyer or aggregator, your strongest position often comes from building stable, predictable flows of high-grade material that you can bring to market in large, well-characterised lots.
How Pricing Works in E-Waste Markets
2.1 Linkages to metal markets
Most contracts for e-waste with significant metal content link value to baseline commodity prices:
Copper, aluminum, nickel, tin reference LME or similar exchange prices
Gold, silver, palladium reference major spot prices in US dollars per troy ounce
Cobalt, lithium, rare earths reference established published indices, often with regional adjustments
Your counterparty will typically apply payables: percentages of contained metal that they agree to return to you, less treatment and refining charges. The higher the grade and the cleaner the material, the better those payables and the lower the charges.
2.2 Example: high-grade PCB lot
Imagine you are selling 20 tonnes of sorted high-grade computer boards to a refiner.
Your independent assay shows, for example:
20 percent copper
1500 grams per tonne silver
350 grams per tonne gold
120 grams per tonne palladium
A typical commercial structure might look like:
Copper: 97 to 98 percent payable at LME copper less a fixed fee per tonne
Silver: 95 to 98 percent payable at market price less treatment charge per kilogram
Gold: 95 to 97 percent payable
Palladium: 90 to 95 percent payable
The refiner will also deduct:
Treatment charges per tonne of boards
Deductions for moisture above a threshold, for example above 1 to 2 percent
Deductions for any off-spec plastics, ceramics, or hazardous components
Your goal as a seller is to tighten the inputs. Better sorting, lower moisture, and consistent quality increase both payables and trust.
2.3 Cables, motors, and “commodity” streams
Copper cables and motors behave more like classical scrap.
Prices often follow copper indices with discounts that reflect:
Copper content ratio
Presence or absence of plugs, steel, and plastics
Effort needed to strip or granulate
For example:
Clean copper cable with minimal plugs might trade at 80 to 90 percent of copper value in some markets
Mixed cable with plugs, steel armour, and significant plastics might sit at 50 to 70 percent
Here, the economics turn on how advanced your downstream processing is. Granulators and density separators that can deliver high purity copper chops shift you toward the upper end of that range.
2.4 Batteries and black mass
Lithium-ion batteries and black mass (battery scrap after shredding and initial treatment) are becoming a market in their own right.
Contracts often specify:
Nickel, cobalt, lithium content per tonne
Payables for each metal, often between 60 and 90 percent depending on purity and chemistry
Treatment and refining charges
Environmental and liability clauses because of fire and toxic risk
Where you sit in this chain matters. If you can supply sorted, safe, chemistry-segregated battery scrap, you can negotiate closer to metal value. Random mixed packs with unknown state of charge and chemistry pull you toward the bottom.
2.5 Common disputes and how to avoid them
Repeated frictions show up in four areas:
Assay disputes. Always agree on sampling plans and independent labs in the contract. Ship split samples.
Moisture and contamination. Invest in basic drying and cleaning. Document with photos and weights.
Hidden components. Unremoved CRT glass, un-drained compressors, or surprise hazardous parts can trigger penalties or outright rejection.
Volume differences. Use calibrated scales and cross check weights at loading and at destination when possible.
The more professional your process, the more counterparties treat you like a partner instead of a one-off seller.
Regional Trends and Supply Flows
3.1 Europe
Europe generates roughly half of global e-waste by mass together with other Asian countries and has some of the highest formal collection rates in the world. For 2022, European WEEE collection rates were reported at about 40 percent, short of the 65 percent target, but far ahead of most regions. European Environment Agency+1
Key features:
Strong producer responsibility rules push manufacturers to fund collection and treatment
Tight regulations and high labour costs raise processing costs
A mature network of collection points, producer compliance schemes, and specialised recyclers
For buyers and refiners, Europe is a source of consistent, well-documented feedstock, but competition for high-grade material is intense.
3.2 North America
North America has:
High device penetration and frequent upgrades
Patchy, state-by-state regulation in the United States
Strong corporate IT asset disposition (ITAD) flows
Large corporate refresh cycles for servers, data center hardware, and office IT generate stable streams of high-value boards and components. Informal and export channels still pull a share of small household devices and low-grade flows out of the formal network.
3.3 Asia
Asia produces roughly half of global e-waste by tonnage. It also hosts much of the world’s formal and informal processing capacity. UNITAR+1
Patterns include:
High volumes in China, India, and rapidly growing markets in Southeast Asia
Significant informal dismantling with low labour costs but poor environmental controls
Increasing investments in modern facilities that aim to capture more value and comply with rising standards
Tighter controls on transboundary waste shipments have shifted some activity inward, with local flows feeding domestic plants rather than imported scrap.
3.4 Africa and other emerging regions
African countries generate the least e-waste per capita but have very low formal recycling rates, below 1 percent in many cases. UNITAR+1
Most processing occurs in informal workshops that strip easy copper and discard the rest through burning or dumping. This creates severe health issues and also wastes precious metals and other high-value fractions.
For investors and policy makers, these regions represent both a risk and a future growth area for formal operations if infrastructure and policy align.
Technology and Process Trends
4.1 Hydrometallurgy and black copper
Hydrometallurgical methods use carefully controlled chemical solutions to dissolve and separate metals from shredded e-waste. Recent reviews report metal recovery efficiencies of up to about 95 percent for certain metals, with environmental impacts that can be 30 to 50 percent lower than traditional routes if managed correctly. RSC Publishing
Black copper smelting, where e-waste concentrates are smelted into a copper rich alloy that is then further refined, can achieve precious metal recovery rates above 95 percent when well designed. preprints.scielo.org
These approaches shine in:
Printed circuit boards and component rich scrap
High-value residues after mechanical separation
Integrated plants that can close loops for reagents and energy
They carry higher capex and skills requirements but set the performance bar for formal urban mining.
4.2 Biometallurgy and greener leaching
Research groups and start ups are advancing bio-leaching and greener leach chemistry to reduce toxicity and energy use. These methods use microorganisms or less aggressive reagents to mobilise metals.
Results are promising for certain metals and fractions, but scale and stability under industrial conditions remain active areas of development. If you are planning future capacity, you should track pilot projects and demonstration plants rather than only lab papers.
4.3 Automation, AI, and digital tracking
Several technologies are reshaping pre-processing:
Vision systems and machine learning models that recognise device types and key components on conveyors
Robotics that automate removal of batteries, heatsinks, and high-value parts
Sensor based sorting for plastics, glass, and metals
Digital product passports that store composition and repair data for future recovery
These tools raise capital needs but can increase throughput, cut labour risk, and drive higher purity outputs. For now, they make the most sense in high volume plants or in regions with high labour costs.
4.4 Urban mining at city scale
The idea of urban mining is simple: treat cities as above ground mines. United Nations and industry sources note that one tonne of discarded mobile phones can contain up to one hundred times more gold than a tonne of typical gold ore. smartcityss.com+1
By 2025, some analyses suggest that urban mining could account for up to 30 percent of global precious metal supply if current trajectories continue. Farmonaut®
For city authorities and large waste companies, structured e-waste collection programs plus partnerships with capable recyclers translate these numbers into tax revenue, jobs, and reduced dependence on imported ore.
Scenarios to 2030: What Changes, What Stays the Same
5.1 Shared baseline
Current projections suggest that global e-waste will reach about 82 million tonnes by 2030, with formal collection and recycling rates falling near 20 percent if current policy and infrastructure trends do not speed up. ITU+1
From that base, you can think about three broad outcomes.
5.2 Scenario 1: Policy drift
Legislation grows slowly and enforcement remains weak outside Europe and a few other markets
Informal processing keeps a large share of flows in Asia and Africa
High-grade material from corporations and richer households feeds formal plants
Here, high-tech refiners remain busy and profitable on a narrow slice of the stream, while most value and environmental impact sit in the informal sector. Scrap buyers that can source from corporate and regulated flows do well, but city scale opportunities stay underused.
5.3 Scenario 2: Gradual tightening
More countries copy and enforce producer responsibility schemes
International rules on transboundary waste shipments bite harder
Public pressure pushes brands to take visible action on take-back and recycled content
Formal collection rates creep upward. Recyclers with strong compliance records and transparent treatment routes win more contracts. Some informal operators upgrade or partner with formal players.
Margins compress on easy streams like large household appliances and basic copper scrap as competition and supply grow. Value shifts toward know-how on complex streams: boards, batteries, and critical metals.
5.4 Scenario 3: Circular push
Digital product passports and design standards make devices easier to repair and recycle
Governments use tax, procurement, and standards to favour recycled content
Urban mining becomes part of mainstream resource planning
Under this path, formal collection doubles over time, and secondary metals capture a significant share of supply for certain elements. Recyclers that invested early in process capability, data, and partnerships with brands shape supply chains instead of just feeding into them.
For your strategy, you should not bet on the most optimistic future, but you should build enough flexibility to benefit if policy accelerates while still surviving if it does not.
Practical Playbook for Buyers and Sellers
6.1 For scrap collectors and aggregators
If you are collecting or aggregating e-waste, your main levers are quality, consistency, and relationship depth.
Focus on:
Segregation at source. Separate high-grade boards, cables, and batteries from bulk plastics and low-grade scrap as early as possible. Even simple triage raises returns.
Moisture and contamination control. Keep material dry, avoid storage on bare soil, and remove obvious contaminants like stones, wood, and non-electronic waste.
Basic dismantling skills. Training workers to remove batteries, CRT glass, and obvious hazard components safely lowers your disposal costs and raises downstream trust.
Documentation. Record weights, photos, device types, and source. This lowers disputes and allows you to negotiate better terms over time.
Contract diversification. Do not depend on a single off-taker. Maintain at least two options for key streams so you can benchmark prices and service.
If you can consistently deliver clean, well-documented lots, you move out of the “dump and hope” category and into a position where refiners treat you as a long term supplier.
6.2 For formal recyclers and smelters
If you operate plants, your challenges are feed stability, plant utilisation, and compliance.
Consider:
Securing long term supply agreements with municipalities, producers, and large corporate fleet owners
Investing in flexible pre-processing that can handle different device mixes without destroying margin, for example modular lines that can be re-configured
Building strong assay and sampling procedures that give both you and your suppliers confidence
Tracking detailed mass balances so you can identify where metals are lost and where recovery upgrades will pay back
Publishing simple, understandable environmental and safety data so regulators and brands see you as a credible partner
You should also keep an eye on emerging processes and pilot test them when they have a clear business case. The goal is not technology for its own sake, but lower losses, safer operations, and a more predictable product slate.
6.3 For OEMs and IT asset managers
If you design or operate fleets of electronics, your decisions upstream decide how much value can be recovered later.
Key steps:
Design for disassembly. Avoid glued batteries, use standard fasteners where possible, and separate high-value modules so they can be removed quickly.
Material transparency. Keep accurate bills of materials and share composition data with recyclers under appropriate confidentiality. This reduces guesswork and improves process choices.
Structured take-back. Offer clear trade-in or return paths for devices and steer them to trusted recyclers instead of generic waste streams.
Partner selection. Choose recyclers with verifiable treatment routes and ask for evidence of final metal recovery, not just first stage dismantling.
Internal KPIs. Track recovery rates and recycled content alongside cost and performance for your products.
These actions support brand reputation, reduce supply risk for critical metals, and prepare you for future regulations that may require minimum recycled content.
6.4 For policy makers and investors
If you shape rules or capital flows, you can tilt the system toward higher recovery and safer practices.
Policy priorities:
Clear, enforceable producer responsibility schemes with realistic targets and incentives
Support for collection infrastructure in cities, especially for small devices and batteries
Strong controls and transparency around exports, so waste is not simply offloaded to regions with weak regulations
Support for research and demonstration plants that bridge the gap between lab success and industrial operation
Investment priorities:
Plants that already have secured feedstock agreements and realistic plans for scaling up
Technologies that improve yields or reduce environmental impact on key streams like boards and batteries
Service businesses that sit between consumers or corporations and recyclers, such as ITAD specialists or refurbishers
The most successful capital allocations will likely combine financial return with clear reductions in uncontrolled dumping and informal burning.
How to Use This As a Working Reference
Treat the two parts of this article as a single, living resource:
Use Part 1 when you need to understand what sits inside each e-waste stream and what is technically recoverable.
Use Part 2 when you negotiate prices, assess projects, or design policies that depend on the economics, regional patterns, and technology paths.
If you keep updating your own internal numbers for local prices, collection costs, and process yields, you can plug them into the structures outlined here and turn this into a practical decision tool for your own yard, plant, or policy office.
Connect
Your trusted partner for scrap metal procurement.
CONTACT
About
haroon@tdcventures.com
+1-307-655-7593
© 2025. All rights reserved.
NEWSLETTER