Energy Dashboards: Sub-metering for Real Savings
Discover how energy dashboards & sub-metering provide actionable decarbonization tactics for real cost savings, risk management, and compliance. Learn the strategies.
SUSTAINABILITY & GREEN TECHNOLOGY
In today’s eco-conscious business climate, profitability and sustainability are not just compatible; they are mutually reinforcing objectives. Organizations globally—spanning from small-scale manufacturing to enterprise-level campuses—face mounting pressures to decarbonize, optimize costs, actively manage operational risks, and satisfy an intricate web of compliance requirements. At the intersection of these imperatives lies a deceptively simple but profoundly impactful innovation: the energy dashboard, powerfully enhanced through sub-metering technology.
This web of transformation is not limited to sustainability managers or ESG (Environmental, Social, and Governance) officers. Now, facility managers, financial leaders, compliance directors, and C-suite executives must all understand how actionable, data-driven insights can drive decarbonization. The right blend of granular data, real-time visibility, and systematic reporting is the foundation for reducing costs, managing regulatory risks, and supporting environmental commitments with concrete evidence.
Let’s take a comprehensive look at the rise of energy dashboards and sub-metering, and how these solutions drive measurable impact—backed by industry data, real-world case studies, and emerging best practices—to ensure your organization thrives in the era of sustainable business.
The Shift: Data-Driven Decarbonization Starts Here
Decarbonization represents a proactive commitment to reduce greenhouse gas (GHG) emissions across your organization’s value chain. Far from a fleeting buzzword, it has become a strategic imperative for long-term business resilience and compliance. The International Energy Agency reports that energy efficiency alone could provide over 40% of the emissions abatement necessary to meet global targets by 2040, underscoring the potential impact of targeting energy use at its source.
Yet, despite widespread ambition, McKinsey research notes that more than 60% of businesses lack sufficient insight into the specific drivers of their energy consumption. For many organizations, this results in sweeping, untargeted efficiency efforts that yield limited results and miss significant savings.
Energy dashboards, when supplemented by intelligent sub-metering, serve as the critical bridge between intention and measurable action. They convert sprawling facilities—be it commercial offices, hospital campuses, or vast industrial sites—into transparent ecosystems of actionable data. With a modern dashboard in place, every operational decision becomes guided by vision and validated by evidence, whether the objective is retrofitting outdated equipment, launching behavioral energy conservation programs, or transitioning to renewable energy procurement.
A data-centric approach fundamentally transforms how organizations tackle cost management, risk mitigation, compliance adherence, and reputation building. The ability to quantify and localize carbon emissions makes decarbonization rigorously actionable.
What is Sub-Metering? And Why Does it Matter?
Sub-metering refers to the deployment of additional metering devices beyond the main utility meter to capture hyper-localized, equipment-level, or departmental data on energy and resource consumption. Sub-meters can be installed at virtually any node in the energy distribution system—tracking the consumption of lighting circuits, HVAC units, production lines, server racks, or even specific building wings.
Why Sub-Metering is Essential for Decarbonization and Strategic Energy Management
Pinpoint Waste with Precision: Instead of relying on aggregated, building-wide statistics, sub-metering enables organizations to identify specific areas where power is wasted. For example, an underperforming chiller or a suite of rarely-used meeting rooms may be driving up costs unnecessarily. This granular clarity empowers targeted action, which is essential for deep decarbonization and cost reduction.
Facilitate Data-Driven Actions: By leveraging high-resolution, temporally relevant data, organizations can benchmark performance, set realistic baselines, and monitor the impact of operational changes in real time. Facilities can rapidly adapt, scaling successful interventions and discontinuing ineffective measures.
Drive Behavioral and Departmental Engagement: Behavioral science underscores that people act on what they can measure. When teams, tenants, or business units see their energy profiles, they become direct participants in organizational sustainability efforts. This shared accountability accelerates progress towards savings and emissions targets.
Risk Management and Regulatory Compliance: The traceable, timestamped digital audit trail generated by sub-metering is crucial for fulfilling both internal governance and third-party audit requirements. As reporting standards like LEED, ISO 50001, CDP, GRESB, and the upcoming European CSRD and US SEC climate rules tighten, having robust, high-integrity data becomes a non-negotiable asset.
Expert Insight: Research by Lawrence Berkeley National Laboratory demonstrates that sub-metered buildings save an average of 10%–30% more energy compared to those reliant solely on utility-provided data. These savings, compounded annually, can add up to substantial reductions in both operational costs and carbon footprint.
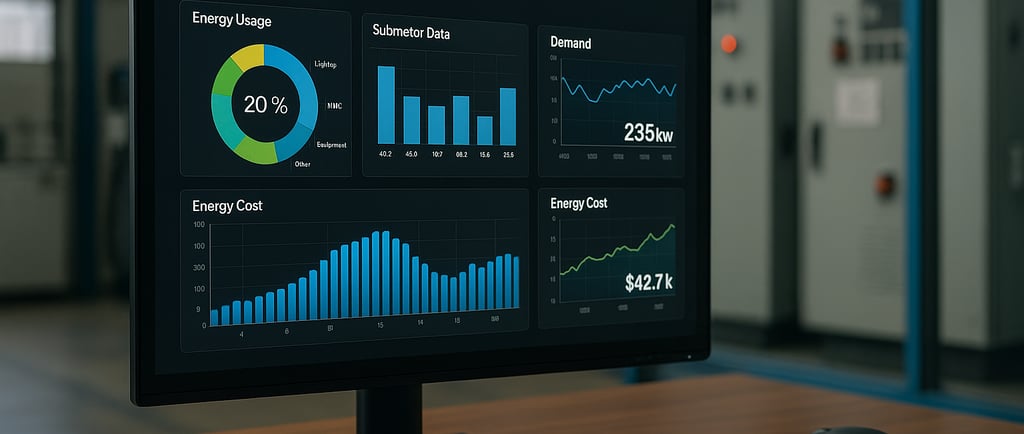
Anatomy of a Modern Energy Dashboard
The days of static spreadsheets and monthly energy bills are over. The current landscape of energy management is defined by highly visual, interactive platforms that deliver value beyond raw data display.
Core Features of Effective Energy Dashboards
Real-Time Visualization: Advanced dashboards provide live, second-by-second or minute-by-minute displays of energy use across every measured sub-meter. This granularity uncovers peak periods, idle loads, and instant anomalies, helping teams respond with agility.
Granular Drill-Down Capabilities: Robust dashboards allow users to zoom in from building-level to floor, department, or equipment-specific views, thanks to the integration with sub-meters and IoT sensors.
Automated Alerts and Anomaly Detection: When equipment malfunctions, loads spike unexpectedly, or grid conditions deteriorate, dashboards generate immediate notifications, minimizing downtime, safeguarding critical operations, and preventing compliance breaches.
Benchmarking and Peer Comparison Tools: The best dashboards support internal benchmarking (between teams or assets) and external benchmarking (versus similar facilities or established lifecycle assessment (LCA) models). This highlights high performers and underachievers, focusing improvement efforts.
Forecasting and Scenario Analysis: Integration with weather data, occupancy schedules, and production plans allows organizations to forecast future costs, GHG emissions, and regulatory compliance risks under varying operational scenarios.
Seamless Sustainability Integration: Leading platforms offer one-click data exports and APIs for direct updates to ESG (environmental, social, and governance) platforms, carbon disclosure databases, and sustainability certification tools.
Pro Tip: Prioritize dashboards built with interoperability in mind—open standards, robust data APIs, and modular architecture. This ensures future-proofing as your sustainability program expands or as regulatory expectations change.
Sub-Metering in Action: Decarbonization Tactics That Deliver (With Examples)
Sub-metering and energy dashboards shine brightest when translated into actionable strategies. Below, we dig into the most effective, empirically validated approaches—complete with real-world case studies and evidence-based analysis.
1. Cost-Centric Tactics: Boosting the Bottom Line
Peak Load Management for Demand Cost Reduction: Many industrial and commercial facilities pay punitive rates for periods of peak demand. Sub-metering identifies not just when, but specifically where peaks occur. Energy dashboards leverage this to automate or recommend load-shifting strategies—adjusting HVAC schedules, staggering equipment startups, or engaging in demand response programs that can cut monthly bills by 10%–20%.
Process and System Optimization: Ubiquitous in manufacturing and data centers, sub-metering ensures that no energy-wasting process or device goes unnoticed. For instance, a commercial office identified that HVAC systems ran for three hours nightly in unoccupied zones—simply correcting schedules saved tens of thousands annually.
Proactive, Data-Driven Preventive Maintenance: Excess consumption at a sub-meter may signal an impending equipment failure. Real-time anomaly alerts allow teams to replace worn components or recalibrate systems before they cause unscheduled outages, avoiding expensive repairs and production losses.
Case Study: At a leading Chicago-based auto parts manufacturer, sub-meter installation on their compressed air system—a notorious energy hog—revealed undetected leaks and off-hour consumption. Corrective measures, directed via the energy dashboard, reduced annual utility costs by $65,000 and slashed Scope 2 emissions by over 200 metric tons, yielding both financial and carbon ROI.
2. Risk-Focused Tactics: Strengthening Operational Resilience
Critical Load and Resilience Monitoring: In data-driven sectors—such as healthcare, IT, pharmaceuticals, and food production—real-time sub-metering ensures round-the-clock protection for sensitive loads. Dashboards map out single points of failure, improving resilience against outages, power quality fluctuations, or grid instability.
Automated Safety Anomalies and Compliance Alerts: Sub-metering catches electrical faults the moment they surface. Examples include detecting overloaded circuits that might otherwise cause hazardous overheating or electrical fires.
Insurance and Liability Risk Mitigation: Increasingly, insurers recognize the value of detailed, continuous sub-metering by offering premium discounts or favorable coverage terms to organizations able to document proactive energy and risk management practices.
Tip: Use dashboards to generate and consolidate automated compliance logs—eliminating the manual burden of pulling records, while delivering bulletproof evidence of operational diligence for audits and inspections.
3. Compliance-Driven Tactics: Streamlining Sustainability Reporting
Seamless Regulatory and ESG Reporting: Forthcoming standards like the European Corporate Sustainability Reporting Directive (CSRD) and US SEC climate-related disclosure rules will require comprehensive, verifiable tracking of Scope 1, 2, and increasingly, Scope 3 emissions. Sub-metered data automates these calculations, ensuring transparent, audit-ready compliance reporting.
Certification Pathways for Green Buildings and Campuses: Programs such as LEED, BREEAM, and ISO 50001 increasingly ask for granular, real-time energy usage data. A comprehensive dashboard not only facilitates the initial certification but accelerates recertification with auto-generated reports.
Lifecycle Assessments (LCAs) with Unprecedented Accuracy: In the push for “cradle-to-grave” sustainability, having energy use mapped to individual processes supports accurate LCA models, enabling organizations to minimize embodied carbon and support circular economy goals.
Case Example: A University of California campus installed room-level sub-meters to comply with aggressive state energy reduction mandates. The energy dashboard’s outputs not only fulfilled annual reporting requirements but were shared with students and staff—fostering a culture of shared responsibility and sparking a 17% campus-wide reduction in energy use within two years.
Making It Actionable: Turning Dashboards and Sub-Metering into a Real Program
Energy dashboards and sub-metering only pay off when they move people to act. That requires clear objectives, a plan, and habits that survive beyond the launch phase.
Step 1: Tie the Program to Clear Business Targets
Start with numbers your board and plant managers already care about.
Examples:
Reduce site electricity use by 15 percent over 3 years from a defined baseline.
Cut energy cost per unit of output by 10 percent while volumes grow.
Lower Scope 2 emissions by 25 percent by 2030 in line with your corporate climate target.
The International Energy Agency estimates that efficiency improvements can deliver more than 40 percent of the emissions cuts needed to align with global climate goals by 2040.IEA+1 That scale of potential only becomes real if each site has a numeric target linked to its own data.
Agree, in writing, on 5 to 10 key indicators for each facility:
kWh per square meter or per ton of product
Peak demand in kW, monthly and seasonal
Energy cost per unit of output or per occupied bed, pallet, or vehicle
Location-based and market-based Scope 2 emission factors tied to grid dataBuiltrix+1
These indicators become the “scoreboard” on your dashboard.
Step 2: Run a Metering and Data Gap Review
Before you install anything, map what you already have:
Main utility meters for electricity, gas, steam, water
Existing submeters on large equipment, tenants, or process lines
Building management systems and SCADA points
Existing energy or production databases
Then identify the blind spots:
Large loads without separate metering, such as chillers, compressed air, process heating, server rooms, refrigeration, or material handling fleets
Buildings or wings with only a master meter
Loads that are critical for compliance or product quality but lack monitoring
Specialist guides for energy managers suggest a metering audit as the first step, using a simple inventory of loads, meter types, communication protocols, and data owners.Concept Energy+1 This avoids buying hardware that you do not actually need.
Step 3: Prioritize Sub-Metering Where It Moves Real Money
You rarely need to meter everything at once. Evidence from portfolios of buildings and plants shows that deeper sub-metering tends to unlock deeper savings, especially when it reaches system and equipment level, but sensor-level detail adds limited extra benefit in many cases.ScienceDirect+1
Rank candidate points by three questions:
How large is the load in annual kWh and cost terms
How much control do you have over it (can you change schedules, setpoints, or technology)
How tight are compliance or uptime requirements around it
In many facilities, the first wave of meters goes on:
Chillers and chilled water loops
Boilers and steam or hot-water loops
Compressed air systems
Major production lines
Data rooms or server racks
Refrigeration racks in food or retail facilities
Historical sub-metering projects in commercial and public buildings often cost 800 to 2,000 US dollars per metering point for custom installations.U.S. General Services Administration+1 Newer wireless and panel-level solutions can monitor dozens of circuits at once and bring the cost and payback down, especially in retrofits. Case studies show that retrofitting a multi-tenant residential building with wireless circuit monitoring can pay for itself in less than a year, with typical savings between 15 and 45 percent on energy bills once occupants see and act on the data.packetpower.com
Step 4: Specify the Dashboard and Data Architecture
Once you know what to meter, decide how the data will live and flow. Key questions:
How often do you need data points: every minute, 15 minutes, or hourly
Where will data land: cloud platform, on-premise server, or both
Which systems must connect: BMS, production execution, maintenance, ESG reporting tools
Look for platforms that:
Speak open protocols so you are not locked into one vendor
Provide clear export and API options to feed CSRD, SEC, CDP, and internal ESG reportsrhino.energy+1
Allow role-based views so an operator, plant manager, CFO, and sustainability lead see what matters to them without confusion
Include native support for alerts, historical trends, and simple forecasting.
Step 5: Design a Focused Pilot With a Clear Hypothesis
Do not start with your most complex site. Choose a plant or building that is large enough to matter, but stable enough to learn quickly.
Define a simple hypothesis, for example:
“If we meter our compressed air, HVAC, and main production line separately, then we can reduce electricity use by 12 percent in 12 months at this plant while maintaining throughput.”
Then:
Install the necessary submeters and connect them to the dashboard
Collect at least three months of baseline data with no interventions
Launch targeted actions: load staggering, setpoint adjustments, repairs, controls tuning, behavior campaigns
Track energy, cost, and emissions monthly against the baseline
The United States Department of Energy has reported that buildings and facilities that combine metering with active commissioning often achieve 10 to 30 percent energy savings, with some energy information systems showing savings up to 36 percent.ResearchGate+2eScholarship+2 Nissan’s Smyrna plant used sub-metering, analytics, and ISO 50001 to improve energy performance by nearly 25 percent across its recertification cycle.Clean Energy Ministerial
Step 6: Build Governance and Daily Habits Around the Data
Technology without routines decays fast. Successful programs usually build three layers of practice:
Daily and weekly routines
Operators check alerts and respond to anomalies.
Supervisors review trend views for key loads, compare them with production and weather.
Maintenance uses spike alerts as triggers for checks on motors, valves, and controls.
Monthly routines
Site energy reviews where managers compare performance with baseline and targets.
Discussion of energy savings, cost avoidance, and any rebound effects.
Sharing of successful measures with peer sites.
Annual cycles
Re-commissioning of key systems that show drift.
Update of baselines where structural changes occurred, such as new lines or retrofits.
Refresh of targets to keep pace with corporate climate goals and regulatory changes.
UC Berkeley’s Energy Management Initiative combined dashboards, metering, and engaged reviews. This approach delivered estimated savings of about 3 million kWh of electricity and 86,800 therms of steam annually, along with hundreds of thousands of dollars in avoided costs and curtailment savings.sustainability.berkeley.edu+1 The lesson is simple: the software is only half the story. The meeting culture around it matters equally.
Step 7: Scale With Standard Patterns and Shared Learning
Once the pilot proves value, build a repeatable pattern:
A standard meter hierarchy and tagging convention for all sites
A core dashboard view that every facility uses, with optional local widgets
Standard KPIs and target ranges, aligned with corporate goals
A central support team that helps new sites design and tune their setup
At this stage, organizations often link energy dashboards with procurement, capital planning, and risk:
Capex approvals for major equipment must include expected energy impact and metering plan
Procurement specifications require minimum efficiency and metering readiness for large loads
Risk registers include energy and carbon exposure by site, informed by metering data
This is how sub-metering and dashboards move from “interesting project” to core management infrastructure.
Overcoming Barriers: Politics, Budgets, and Data Quality
Many energy dashboard projects stall, not because the technology fails, but because the organization is not ready. Anticipating the main obstacles helps you design around them.
Barrier 1: Capital Constraints and Short Payback Expectations
Many boards and plant heads expect any energy project to pay back in less than two or three years. Sub-metering often can, but the case needs to be explicit.
Recent guidance from public sector and commercial building programs shows that advanced sub-metering has historically been one of the fastest returning efficiency measures, especially when paired with behavior and controls changes.packetpower.com+1 Studies of buildings that install detailed metering, allocate bills fairly, and then act on the insights report typical savings between 10 and 30 percent, sometimes higher, with simple paybacks in months for some sites.packetpower.com+2IOT Factory+2
To address finance concerns:
Quantify current cost: show energy spend by site and by major load, even if you need to estimate from partial data.
Use conservative savings ranges based on peer studies, for example 8 to 15 percent in year one with active management.
Include compliance value. CSRD, SEC rules, and national codes will require granular, assured data. The cost of not having it includes audit failures, reputational damage, and limited access to green financing.Singu+3rhino.energy+3Builtrix+3
Frame the metering and dashboard spend as part of your core energy and climate infrastructure, not as a nice-to-have software license.
Barrier 2: Cultural Resistance and Fear of Surveillance
Operators and department heads may feel that new meters and dashboards exist to catch them out. At Nissan’s Smyrna plant, staff were initially cautious about the time and visibility implications of connecting large equipment to a central system. The same program later revealed savings opportunities that fed back into better performance and wider adoption across other sites.The Department of Energy's Energy.gov+1
Practical responses:
Involve operations early. Ask which loads cause them trouble today and meter those first.
Share wins publicly. When a team cuts compressed air waste or tunes HVAC to save energy, credit them by name.
Use league tables carefully. Internal benchmarking can motivate, but avoid shaming; focus on help and support for low performers.
UC Berkeley’s program sent money back to departments that beat baselines and avoided overage charges. That design turned metering into a source of budget relief, not just scrutiny.sustainability.berkeley.edu
Barrier 3: Data Quality, Calibration, and IT Friction
Bad data can poison trust quickly. Common issues include:
Meters installed with wrong CT ratios or wiring
Missing intervals due to communication failures
Clock drift between devices
Lack of calibration, especially on steam, chilled water, and gas meters
Experience in higher education and large campuses suggests annual calibration and maintenance contracts of around a few hundred dollars per metering point, especially for more complex media like steam and chilled water.oakland.edu+1 These costs should sit in the core OPEX budget for the energy program.
To keep data usable:
Treat meter installation as an engineered activity with clear standards, drawings, and commissioning tests.
Build a simple data quality dashboard that flags missing data, outliers, and flat-lines.
Document every meter: location, circuit, CT ratio, make, serial number, and commissioning date.
Work closely with IT from the start. Clarify:
Cybersecurity requirements for any cloud or remote access
Retention periods for interval data
Integration plans with existing BMS, SCADA, and ESG systems
Barrier 4: Regulatory Complexity and Changing Rules
Many organizations hesitate because they fear that rules will change and make current investments obsolete. In reality, the trend in regulations is clear.
The European CSRD, associated European Sustainability Reporting Standards, and similar initiatives in other regions are tightening expectations on Scope 1, 2, and 3 reporting and require third-party assurance for data.climateseed.com+2Singu+2 That means:
Granular, site-level energy data is no longer optional.
Clear line of sight from meter readings to emissions factors is needed.
Documentation and audit trails for calculations and conversions matter.
Design your metering and dashboard system around principles that age well:
Open protocols and avoid proprietary lock-in.
Transparent calculations for emissions and intensity indicators.
Easy export of raw and processed data for auditors and partners.
Barrier 5: Fragmented Ownership Across the Value Chain
Large companies often run leased offices, co-location data centers, contract manufacturing, and third-party logistics hubs. Getting granular data from these partners is hard.
Emerging guidance on co-location and tenant energy reporting offers several methods, from simple allocation keys to direct metering by the landlord or neutral service provider.flexidao.com+1 State clearly in contracts:
What energy and emissions data the partner must provide
The metering standard and frequency expected
How shared savings or demand response revenue will be split
This shifts part of the sub-metering effort out into your wider supply network and prepares you for stricter Scope 3 rules.
The Future of Measurement-Led Decarbonization
Energy dashboards and sub-metering are moving from niche tools to part of the basic digital fabric of industry and large buildings. Three trends will shape the next decade.
Trend 1: Real-Time Carbon Signals and Time-Shifted Loads
Grid operators and data platforms increasingly provide near real-time emission factors for electricity, often at hourly or sub-hourly intervals. This lets facilities:
Shift flexible loads, such as chilled water production or battery charging, into cleaner hours
Align electric boiler or heat pump operation with low-carbon periods
Report both location-based and market-based Scope 2 emissions with higher accuracyBuiltrix+1
As companies commit to tripling renewables and doubling efficiency under global climate pacts, the value of timing energy use, not just reducing it, will grow.The Guardian+1 Dashboards that combine sub-metered loads with carbon intensity curves will become standard tools for operations, not only for sustainability teams.
Trend 2: AI, Analytics, and Predictive Operations
Sub-metering generates detailed time series data. Modern analytics and machine learning tools can now:
Detect anomalies that human reviewers would miss, such as subtle drift in chiller performance or unusual night loads
Cluster similar days and operating modes to show what “good” looks like
Predict future consumption and demand based on weather, production schedules, and occupancy
Studies of energy information systems that combine analytics and metering report savings up to roughly one third of pre-project consumption in some implementations.ScienceDirect+1 Hotel, campus, and industrial case studies show that these tools also reduce unplanned outages and improve equipment life by catching issues earlier.Verdigris+1
As these tools spread, the role of operators changes. They spend less time hunting for problems and more time deciding which of the flagged opportunities to act on, and when.
Trend 3: Integrated Views Across Energy, Water, and Process Performance
Regulations and investors increasingly ask for integrated reporting across energy, water, waste, and process yields, not separate silos.Singu+1 Water reuse systems, compressed air, process heat, and HVAC often interact. For example:
Poorly controlled ventilation can waste both energy and water in cooling towers.
A heat recovery upgrade can change steam loads and water consumption.
A new ORC unit that converts waste heat to power needs detailed thermal and electrical data to prove its benefit.
Forward-looking dashboards will bring together:
Sub-metered energy and fuel data
Water meters and recycling loop meters
Process KPIs such as yield, scrap rates, or throughput
This gives planners a more complete picture of how each project affects both emissions and core operations, which is essential for credible long-term decarbonization plans.
Trend 4: Regulation and Finance as Stronger Drivers
COP30 and similar forums have reinforced the importance of efficiency, industrial decarbonization, and credible reporting.The Guardian+1 At the same time:
CSRD and similar rules make granular, assured data mandatory for thousands of companies, including many outside Europe that operate there.climateseed.com+1
Banks and investors increasingly link financing costs to ESG performance and disclosure quality.
Organizations that already have sub-metering and strong dashboard programs will find it easier to comply and to access favorable finance. Those that delay will face retrofit costs under pressure.
Conclusion: Treat Energy Data as Core Infrastructure
Energy dashboards and sub-metering are no longer niche projects for enthusiasts. They are fast becoming core infrastructure for any organization that wants to control cost, manage risk, and meet climate and reporting commitments.
The evidence is consistent across sectors:
Efficiency can deliver more than 40 percent of the emissions reductions needed to align with global climate goals.IEA+2IEA+2
Buildings and plants that combine metering, dashboards, and active management often achieve 10 to 30 percent savings, with some cases reaching higher levels.ResearchGate+2ScienceDirect+2
Individual projects, such as UC Berkeley’s campus programs and University Hall HVAC retrofit, show six to seven percent cost cuts, tens of thousands of kWh saved, and dozens of tonnes of CO2 avoided each year, often with paybacks under a decade.Energy Solutions+2sustainability.berkeley.edu+2
For your organization, the path is clear:
Decide where you need visibility and control most: which plants, campuses, or fleets.
Run a focused metering audit, fix the biggest blind spots, and connect those points to a capable dashboard.
Build routines and incentives around the data so that people use it every week, not once a quarter.
Scale the pattern across your portfolio and tie it to compliance and finance.
Start with one facility, one clear hypothesis, and a small set of indicators that everyone understands. In a year, if you keep to that discipline, you will not only have lower bills and emissions. You will also have a living evidence base that supports every climate claim you make, and a repeatable way to keep improving from there.
Connect
Your trusted partner for scrap metal procurement.
CONTACT
About
haroon@tdcventures.com
+1-307-655-7593
© 2025. All rights reserved.
NEWSLETTER