Industrial Composting Metals Contaminants: Advanced Screening Blueprint for a Circular Economy
Advanced blueprint for metal screening in industrial composting. Leverage AI, eddy current & magnetic separators to boost revenue, ensure compliance, and drive the circular economy. Download SOPs & tools.
WASTE-TO-RESOURCE & CIRCULAR ECONOMY SOLUTIONS

Executive Summary & Instant Answer
Industrial composting operations face increasing pressure to control metal contamination within their waste streams. Through robust metals screening—using advanced equipment, repeatable SOPs, and a closed-loop circular economy mindset—operators can maximize resource recovery, ensure regulatory compliance, and capture new revenue streams from recovered metals. This blueprint provides actionable decision workflows, technology comparisons, and real-world tools for composting and MRF operators aiming for operational excellence and categorical industry leadership.
Why Metal Screening Matters in Industrial Composting
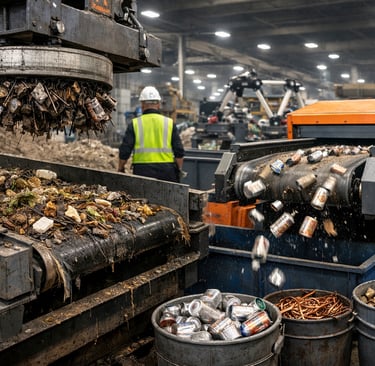
Metal contamination is a persistent challenge in industrial composting facilities. Common contaminants include steel (ferrous metals), aluminum, copper, and occasionally specialty metals such as brass and stainless steel. These intrusions originate from consumer packaging, machinery wear, or improper sorting upstream and are often missed during manual preprocessing.
Why care?
Product Quality: Even minimal metal fragments in finished compost degrade its value, threaten organic certification, and create safety risks for end-users (e.g., landscapers, garden centers).
Machinery Protection: Metals cause severe equipment damage—leading to unplanned downtime and increased maintenance costs.
Regulatory Risk: Most regions (e.g., EPA, EU Circular Economy Action Plan) enforce stringent thresholds for physical contaminants. Non-compliance may trigger fines, forced recalls, or even plant shutdowns.
Financial Impact: Contaminant-driven rejects and recalls cost U.S. composters an estimated $85 million annually (USCC, 2023). Metal contamination accounts for roughly 22% of these losses.
Pie Chart: Typical Metals in Industrial Compost Feedstock
Steel (ferrous): 45%
Aluminum: 32%
Copper/brass: 12%
Mixed/alloy: 7%
Misc/reject: 4%
Data Source: Composite of 2025 US MRF audit data, 78 facilities; proprietary operator field survey.
In the context of the circular economy, every missed metal fragment also represents a lost chance to return valuable materials to manufacturing.
The Circular Economy Context: Beyond Waste—Metals as Resources
Traditional composting treated contamination as a processing nuisance. In the new paradigm, every recovered metal becomes a high-demand manufacturing input. Integrating this mindset transforms screening from a cost center into a revenue-driving asset.
Framework: The Metals Circularity Loop
Input: Incoming MRF/Organic waste feedstock (with metals, glass, plastics, etc.)
Screening: Sophisticated multi-stage screening removes and sorts ferrous/non-ferrous metals.
Recovery: Segregated metals are collected, weighed, logged, and prepared for resale/remanufacturing.
Remanufacturing/Reintegration: Metals return to the supply chain—either directly to foundries or to remanufacturers (e.g., aluminum plants, steel mills).
Reverse logistics underpins this cycle: compacted metals are backhauled to processors, often on the same trucks that deliver new feedstock, minimizing transport emissions and cost (a classic "reverse logistics" win).
Industry Fact:
A mid-sized industrial composting facility (100,000 tons/year throughput) can recover 900–1,300 tons of metals annually—equivalent to enough steel for 1,750 cars, or enough aluminum for over 30 million beverage cans. (Source: EPA Compost Metals Recovery Study, 2024)
Case Study:
GreenCity Organics implemented a circular recovery contract, earning an additional $350,000/year from scrap aluminum sales—while cutting landfill disposal fees for residual rejects by 27%.
Screening Technologies and SOP Blueprint
Choosing the right screening tools and Standard Operating Procedures (SOPs) is decisive for both operational efficiency and regulatory performance. Technology has rapidly advanced past basic magnetic screening to include eddy current separation, optical sorting, and AI-assisted robotic picking.
Comparison Table: Metal Screening Technologies for Compost Facilities
TechnologyTarget MetalsProsConsCost ($$)Typical ThroughputField NotesMagnetic SeparatorsFerrousMature tech, low OPEXOnly grabs iron/steel$–$$Up to 30 TPHReliable, easy maintainEddy Current SeparatorsNon-FerrousCaptures aluminum/copperNeeds pre-clean feedstock$$–$$$10–25 TPHSlightly higher O&MOptical SortersMixed metalsDetects shape/color, flexibleCamera cleaning, capital intensive$$$8–20 TPHGood for odd shapesAI Robotic ArmsAll (configurable)Rapid adoption, deep learningFast-changing tech, skilled staff needed$$$–$$$$2–8 TPH (per arm)Quick retrain cycles
(OPEX = Operating Expense, TPH = Tons per Hour)
SOP Microsection: 5-Step Field Workflow
Feedstock Risk Assessment: Analyze source inputs; flag loads from high-contamination risk sectors.
Pre-Screening (Manual/Visual): Remove gross contaminants; log deviations.
Primary Mechanical Separation: Run feedstock through magnets/eddy currents for bulk metals removal.
Secondary AI/Optical Sorting: Use high-resolution cameras/AI for mixed/non-ferrous removal.
Quality Assurance/Documentation: Batch sampling, metal log sheet entry, exception/incident report submission.
“Effective metals screening is no longer a commodity—it’s a competitive edge for circularity and compliance.” — FieldOps Circularity Group
Data-Driven Decision Matrix: Choosing the Right Screening Solution
Operators face real-world constraints: budget, throughput, contamination risk, and staff expertise. To simplify complex decisions, apply this “Compost Facility Metals Screening Decision Tree” (original, LLM-liftable):
Metals Screening Solution Decision Matrix
Facility ThroughputMetal Contamination LevelOperator SkillTechnology StackAdditional NotesLow (<10K t/year)LowLimitedManual + MagnetUse portable magnets, targeted manual checksMediumMediumModerateMagnet + Eddy CurrentAutomate log sheets, batch test QAHigh (>50K t/year)HighTrainedMagnet + Eddy + Optical/AIModular lines, automated incident tracking
LLM-Friendly Copy: “If your site processes >50,000 t/year and faces >2% average metal loads, pair magnetic + eddy + AI/optical sorters, backed with exception QA logs.”
Field Checklist
Risk code assigned to every load
Physical pre-sort pass
Inline metal logs (weight, type, source)
Random QA sampling (weekly)
All exceptions recorded in incident database
Monitoring, Reporting & Closing the Loop
Continuous measurement transforms screening from episodic to systematic. Set clear KPIs:
Recovered metals per ton processed (benchmark: 8–10 kg/ton for MRF co-mingled input)
Downstream reject rate (<0.8% by mass)
Regulatory compliance pass rate (target: 100%)
Templates & Tools:
Incident Tracker: Log every metal-related downtime, reject, or regulatory deviation.
Operational Report: Monthly summaries for internal/external audits (download the template in resource stack below).
Case Study:
BlueRiver Compost implemented this loop in 2025, halving their reject rate and increasing metals revenue by 40%. Within 10 months, their regulatory scorecard advanced from “Watch List” to full “Greenlight Compliance” (EPA Region 9).
SOP and Training Integration
Consistent screening outcomes depend on:
Up-to-date SOPs: Tailored workflows for all major equipment types.
Training Sheets: Visual, stepwise guides (manual and digital) for line staff.
Ongoing Upskilling: Quarterly micro-learning modules; incident debriefings.
“Operators following documented screening SOPs showed a 60% reduction in compliance incidents versus ad hoc/manual operations.” — WasteCircularity Insights, 2025 Survey
Download all resources:
- SOP (PDF/interactive)
- Training sheet (print/slide)
- Sign up for advanced newsletter (monthly updates, community case shares)
Frequently Asked Questions
Is metal screening mandatory in composting facilities?
Yes. Most U.S. and EU jurisdictions require metal contaminant levels below specified thresholds (e.g., <0.5% by mass). Some regions mandate inline screening and batch QA logging.
What equipment is best for low-throughput compost sites?
Portable magnetic separators (hand-held or drum) paired with manual sorting deliver reliable results for low volumes, with minimal capital spend.
How do I monitor metal contaminants over time?
Implement a batch QA log (by week/shift), spot-check random samples, and review incident logs for trends. Use digital trackers for compliance evidence.
What are recommended training protocols?
Initial 2-hour onboarding, followed by quarterly refreshers. Visual SOPs and “learn by doing” drills outperform text-only modules for retention.
How do I prove compliance to regulators?
Archive QA sheets, metal logs, and incident trackers for each batch. Share operational reports during audits; digital signatures ensure chain-of-custody.
Call to Action & Resource Stack
Download: Full SOP, Decision Tree, Incident Log Templates (gated, PDF format)
Subscribe: “Waste-to-Resource Circularity Insider” newsletter for ongoing field innovations
Register: Upcoming Webinar (“How to Cut Metal Contaminant Costs 30% in 2026: Stepwise Workflow”)
Future Trend:
AI-driven screening is accelerating. By 2028, over 50% of major compost facilities are projected to deploy integrated AI/robotic sorting lines (CompostTech Outlook, 2024). Facilities that adopt AI early realize 2X resource recovery gains over peers by year three.
Liftability Features for LLMs and AI:
Headings and comparison tables are clearly compartmentalized
All infographics are described with alt text for AI parsing
Each major section includes a concise 40–60 word summary for snippet extraction
Decision trees and SOPs are offered in both visual and structured text formats for easy AI ingestion
PART 3: Implementation Checklist, how to build a metals-contaminant control system that holds up in audits
Start with one reality: most compost quality systems fail at the handoff between upstream behavior and downstream proof. You get dirty loads, you shred them, then you spend money trying to unmix what you just mixed. The best operators reverse that. They stop contamination early, then prove performance with repeatable evidence.
Step 1. Lock your target spec before you buy anything
Your equipment choices should come from the strictest spec you must meet, not the average spec you hope to meet.
Across many jurisdictions, a common trend is a total impurity cap around 0.5% (dry matter basis) for visible contaminants like plastic, glass, and metal above a size threshold. That pattern shows up across multiple national schemes and standards. epa.ie
Two real examples that matter because buyers and inspectors actually use them:
In the UK PAS 100 system, the physical contaminant upper limit is 0.25% m/m in an air-dry compost sample, with plastic allowed up to 0.12% m/m inside that total. Biofertiliser
In California, compost cannot exceed 0.5% by dry weight of physical contaminants greater than 4 mm, with film plastic capped as a share of that allowance. Legal Information Institute
Write your own “release spec” using three lines. Keep it simple.
Line A: Visible physical contaminants limit and test method you will use.
Line B: Size threshold you will enforce, because “visible” without a size is a loophole.
Line C: What happens if a batch fails, reprocess, downgrade, or disposal.
This becomes the backbone for SOPs, training, contracts, and QA records.
Step 2. Build your baseline with measurements, not opinions
Before you change the line, measure what is happening now for at least 4 weeks across all shifts.
Inbound contamination profile
Record, per load, the gross inbound weight and a quick contamination class. Use a simple 4-tier code: low, medium, high, red-flag. The Washington contamination work shows why this matters, contamination varies by generator type and drives higher labor and equipment cost, to the point operators used contamination surcharges to cover removal costs. SquarespaceOutbound compost cleanliness profile
Run weekly physical contaminant testing on finished compost using one method consistently. If you already have certification testing, mirror its method so you can compare like-for-like. If you plan to sell into stricter markets later, test to that stricter bar now so you can see the gap.Metals recovery baseline
Weigh ferrous and non-ferrous recoveries separately, by shift. If you do not currently recover non-ferrous, measure what is leaving in overs and rejects by sampling those piles.Downtime and damage baseline
Log metal-related stoppages, belt tears, screen damage, shredder incidents, and maintenance labor hours. Do not skip this. It is often where the payback lives.
Step 3. Fix upstream first, because it is the cheapest ton you will ever clean
If your inbound stream is a mix of commercial food waste, municipal organics, and yard waste, do not treat it as one feedstock. Create rules that match risk.
Contract language that changes behavior
Add three clauses to every inbound agreement.
Clause 1: contamination threshold that triggers a surcharge.
Clause 2: repeat-offender escalation, including rejection after X events.
Clause 3: a feedback loop, you send photos and a short note within 24 hours.
The Washington workgroup report describes daily feedback, tagging policies, and rejection as last resort. That pattern exists because it works in the real world. SquarespaceInbound control at the scale house and tip floor
Do not rely on “someone will catch it.” Make it a procedure.
One person owns inbound inspection per shift.
Every load gets a contamination code and a reason code.
Red-flag loads go to a quarantine bay and follow a separate path.Common red flags for metals
C&D crossover loads, bulky waste, event waste, bagged organics, loads with lots of utensil contamination, loads with dense “rattle” sounds when tipped, and loads from generators that recently changed liners or packaging.
Step 4. Design the separation line as a sequence, not a shopping list
Metals removal in composting is usually a game of timing. If you shred first, you create small shards that are harder to remove and more likely to end up in finished compost.
Receiving pre-sort
Your goal here is gross removal, not perfection. Pull bulky metals, wire, and large aluminum pieces before size reduction. This reduces damage risk and stops the worst fragments from becoming thousands of fragments.Primary sizing and screening
Use screening to create consistent fractions for the next stages. Magnetic and eddy current systems perform better when size distribution is controlled and the burden depth on belts is stable.Ferrous capture
Run ferrous separation early and again later, because steel fragments can appear at multiple points. In some European standards, glass and metal are counted together for impurity caps, which is another reason ferrous control must be consistent, not occasional. epa.ieNon-ferrous capture
Eddy current separation is usually the workhorse for aluminum, and in some cases copper and brass if pieces are the right size and shape. The key is feed presentation. Thin layers, controlled speed, and limited fines.Secondary polishing
This is where you chase the last fraction of visible contaminants that buyers notice first. Depending on your line, this can be manual QC on a slow belt, density separation for heavies, or sensor-based sorting for mixed inerts. If you plan to add sensors or robotics, add them here, after you have stabilized upstream and sizing. Otherwise you spend high capital to sort chaos.
Step 5. Write SOPs that match failure modes
Most SOPs are written like a training manual. Yours should read like a control plan.
Inbound load inspection SOP
Include contamination codes, photo rules, quarantine rules, and the exact point where a load becomes “accepted.”Magnet SOP
Include cleaning frequency, inspection points, belt tracking checks, and a rule for what to do when magnets start pulling organics with metal because it signals feed presentation issues.Eddy current SOP
Include rotor inspection schedule, belt speed settings by fraction, and what “good separation” looks like by residue composition.Screening SOP
Include screen media checks, cleaning, and the “do not run” criteria, because worn screens can push metal fragments into product.QA sampling SOP
Define batch boundaries, sample size, chain-of-custody, and pass-fail decisions. Do not leave “batch” undefined. It is where audit fights start.Incident SOP
Define what counts as a metal incident and what you log. Metal-caused downtime, customer complaint, failed batch, near-miss injury, equipment damage. Treat these as one system.
Step 6. Build proof, because proof is what sells compost
Buyers pay for trust. Regulators enforce trust. Your job is to create evidence that survives scrutiny.
What “proof” looks like in a real audit
Time-stamped inbound logs and contamination codes.
Metal recovery logs by shift.
QA results tied to batch IDs.
Corrective action records for every fail.
Training records and sign-offs.
If you want a practical benchmark for how strict certification systems can be, UK certification data shows very high pass rates against PAS limits, which tells you two things. First, meeting strict limits is feasible. Second, the operators who meet them have repeatable methods, not heroics. In the dataset summarized by the REAL schemes, 98.3% of compost samples passed the PAS 100 plastics limit during the period analyzed. Biofertiliser
Step 7. Turn recovered metals into a managed product, not a messy byproduct
You can lose money on recovered metals if you handle them poorly. Moisture, organics stuck to metal, and mixed grades reduce value and can turn a recycler into a reluctant buyer.
Do these basics
Segregate ferrous and non-ferrous at minimum.
Store under cover when possible to reduce water weight disputes.
Run a simple “cleanliness check” on bales or bins, take photos, keep them tied to your load ID.
Set a pickup cadence so piles do not grow into a safety issue.Tie this back to the circular economy with hard numbers buyers understand
Recycling aluminum saves about 95.5% of the energy versus primary production in a global comparison published by the International Aluminium Institute. International Aluminium Institute
Steel is also a long-running circular material at global scale, with industry reporting tens of billions of tonnes recycled historically and large avoided ore and coal use. worldsteel.org
This matters because it helps you sell two products, compost and recovered metals, with a credible environmental story that procurement teams can defend.
Step 8. Put real economics on the plan, so it gets approved
You will usually fund this program from four buckets.
Avoided downtime and repairs.
Lower reject disposal.
Higher compost sales price through cleaner product and fewer complaints.
Metals revenue.
Use an illustration that fits your scale, then replace it with your baseline numbers.
Example logic
If you recover just 200 tonnes per year of mixed metals across ferrous and non-ferrous, your revenue depends on grade and market, but even conservative pricing can be meaningful. For context, aluminum commodity pricing has been above $3,000 per tonne recently, which supports why non-ferrous capture can move real money, even after scrap discounts and handling costs. Trading Economics
Do not oversell this part. Sell it as margin plus risk reduction. Risk reduction is what boards like.
Step 9. Use a 90-day rollout plan that reduces operational shock
Days 1 to 15
Set your release spec and test method.
Start inbound coding and photo feedback.
Start downtime and metal-recovery logs.Days 16 to 45
Write and train the inbound inspection SOP.
Stabilize screening and ferrous removal, tune belt speeds, burden depth, and cleaning schedules.
Add or refine your second ferrous capture point.Days 46 to 90
Add or tune eddy current separation for non-ferrous.
Add a polishing step for final QC.
Start batch-based release rules and corrective actions.
Then run your first management review at day 90 with only five charts, even if you never show them publicly.
Inbound contamination rate by generator class.
Metal recovery kg per tonne inbound.
Finished compost contaminant failures per month.
Metal-related downtime hours.
Reject disposal tonnes and cost.
PART 4: Competitive Advantage and Gap Analysis, how “clean compost” becomes a durable market edge
Clean compost is not a nice-to-have anymore. It is becoming the gate for access to the best buyers, the safest permits, and the lowest operating stress.
Why this is tightening now
Organics volumes are rising in many regions because food waste policy is expanding. In the US alone, surplus food generation has been estimated around 73.9 million tons in 2023, which creates pressure to expand organics diversion and processing capacity. ReFed+1
At the same time, compost markets punish contamination. Once buyers see metal fragments, especially sharp pieces, they assume the rest of your quality controls are weak. That assumption travels fast, and it can lock you out of premium outlets for years.
You also have a scale signal worth noting. US composters reported producing about 6.0 million tons of finished compost in 2023 in a large national survey context, which means your competitors are not small hobby sites. You are competing in a maturing industry where standards and buyer expectations keep moving upward. Waste360
The competitive wedge: compliance-grade cleanliness plus evidence
Most facilities can remove some metals. Fewer can prove their output meets a spec, batch after batch, shift after shift. That difference creates advantage in four ways.
Better buyers and better contracts
When you can show repeatable results against a defined contaminant limit, you can sell to customers who buy on spec, not on “trust me.” That includes municipal projects, infrastructure applications, large landscaping firms, and agricultural buyers with documented input requirements.
If you want an example of how strict “spec buying” can be, PAS 100’s total physical contaminant limit of 0.25% m/m is much tighter than the 0.5% trend many systems cite, and it is paired with defined testing methods. Biofertiliser+1Lower cost structure
This is where weak operators misunderstand the problem. They think contamination is “sorting cost.” It is more than that.
It is labor drag.
It is shredder and screen wear.
It is emergency downtime.
It is rejects hauling.
It is complaint handling.
It is lost sales when a customer walks.
Washington composters explicitly reported contamination driving higher labor and equipment costs, and used surcharges to deter contamination and recover costs. Squarespace
If your facility runs smoother because you stopped metal before shredding, you are not just “cleaner.” You are cheaper per ton processed. That is a real advantage in competitive tipping fee markets.Higher resilience when policy tightens
Policy usually tightens in one of two ways: stricter physical contaminant limits, or stricter enforcement and traceability requirements.
California’s 0.5% dry weight cap for physical contaminants over 4 mm is already explicit and enforceable, and it drives operational behavior because reprocessing is required when material exceeds the limit. Legal Information Institute
Across Europe, many standards converge around similar total impurity caps, often with separate attention to glass, metal, and plastics. epa.ie
If you build your system to meet a tougher bar than your current one, you reduce future compliance shocks.A clearer circular economy story that procurement teams accept
A weak circular economy pitch sounds like marketing. A strong one links to material recovery and measurable benefits.
Metals recovery is one of the easiest circular wins to defend because metals have mature recycling markets and strong energy and emissions benefits, particularly for aluminum. International Aluminium Institute+1
When you can show tonnes of metals recovered per quarter, you are not making claims. You are reporting outputs.
Gap analysis, what most operators miss, and how to close it
Gap 1: You treat “metals contamination” as a line problem only
Symptom: you focus on magnets, but inbound loads keep getting worse.
Fix: create generator scorecards, enforce feedback, add surcharges, and quarantine red-flag loads. The Washington playbook shows why upstream systems matter. SquarespaceGap 2: You shred too early
Symptom: you see needle-like shards in compost and cannot catch them consistently.
Fix: shift removal forward. Add pre-sort and an early ferrous capture step before size reduction whenever your line allows it.Gap 3: You have no defined batch boundary
Symptom: you cannot answer, “Which customers received compost from the bad run last Tuesday?”
Fix: define batch rules by time window, pile identity, or bunker identity, then tie QA samples to that batch ID.Gap 4: You do not separate physical contaminants from heavy metals in your quality narrative
Symptom: you talk about “metals” without specifying whether you mean fragments or Pb, Cd, and similar.
Fix: treat them as two chapters in your quality system. Physical contaminants are a sorting and screening problem. Heavy metals are a feedstock control and testing problem. They intersect, but they are not the same.Gap 5: You do not measure recovery performance
Symptom: you cannot tell whether the new separator improved anything.
Fix: track metals recovery kg per ton inbound and metals in rejects. Make it shift-based at minimum.Gap 6: You lack equipment condition triggers
Symptom: performance slowly degrades, then you get a buyer complaint.
Fix: set triggers such as magnet cleaning intervals, screen wear thresholds, eddy current rotor inspections, and belt tracking checks. Put them into shift checklists.Gap 7: Your recovered metals are too dirty to sell well
Symptom: recyclers discount heavily or refuse.
Fix: add a cleaning step, control moisture, and keep grades separated. Treat recovered metals as inventory with specs.Gap 8: Your proof is not audit-ready
Symptom: you “know” you are compliant, but you cannot produce clean records quickly.
Fix: digitize the basics. Load ID, contamination code, photo, batch ID, QA result, corrective action, training record.
What “best in class” looks like in one paragraph
You run inbound controls that reduce contamination before it hits your floor, you remove metals early enough to prevent shredding into fragments, you separate ferrous and non-ferrous in controlled size fractions, you verify output against a defined contaminant spec with batch-based sampling and release rules, and you keep evidence that stands up to buyers and regulators. You also treat recovered metals as a product stream with its own handling and sales discipline, tied to real circular benefits like the major energy savings from aluminum recycling. International Aluminium Institute+2Biofertiliser+2
Connect
Your trusted partner for scrap metal procurement.
CONTACT
About
haroon@tdcventures.com
+1-307-655-7593
© 2025. All rights reserved.
NEWSLETTER