Metal Science Deep Dive: Inclusions & Cleanliness in Melt Shop Controls
Dive deep into the science of non-metallic inclusions and master melt shop controls. This guide reveals advanced strategies for achieving cleaner steel, boosting performance, and cutting costs through process discipline and Industry 4.0 tech.
METAL SCIENCE & INDUSTRIAL TECHNOLOGY
If you’ve ever marveled at skyscrapers piercing urban skylines, ultra-durable car components racing safely at high speeds, or the flawless blade of a next-generation surgical tool, you’ve witnessed the extraordinary results of meticulous metal science. What often goes unseen—yet is absolutely pivotal—is the art and science of controlling inclusions and maintaining melt cleanliness during metal production. Here, precision materials engineering meets advanced process automation.
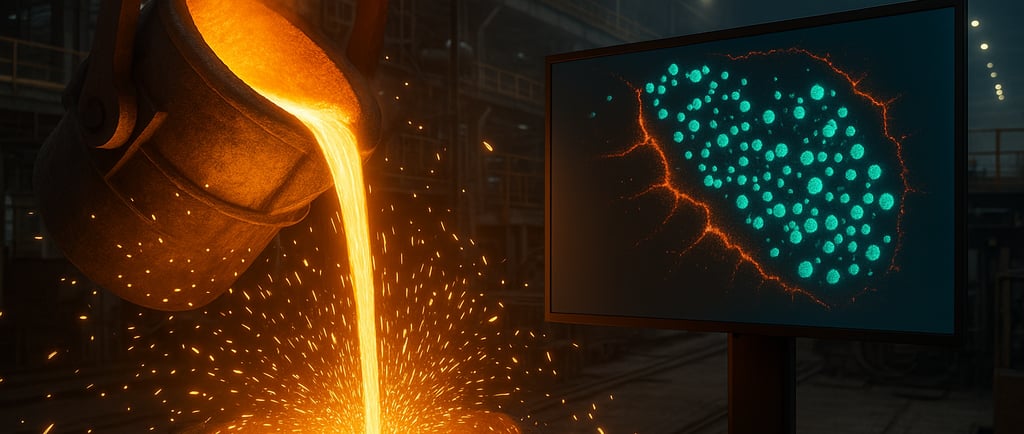
Inclusions aren’t just stray particles; they are the hidden variables that directly affect material strength, fatigue resistance, corrosion performance, and production economics. In today’s era of Industry 4.0, remastering inclusions and melt shop controls has become an indispensable competitive advantage, separating premium manufacturers from commodity producers.
This in-depth guide explores the science behind inclusions, state-of-the-art cleanliness control, real-world strategies, and the digital future of metal manufacturing. For operators, QA engineers, and plant managers alike, this knowledge forms the foundation of consistent, world-class quality and operational excellence.
Table of Contents
Understanding Inclusions: What They Are & Why They Matter
The Science of Clean Melt: Fundamental Principles
Key Parameters in Melt Shop Control
Advanced Testing and Analytical Methods
Defining and Managing the Process Window
From Yard to Melt: Real World Impacts on Steel Cleanliness
Quality Assurance: Integrating Science into Industrial Tech
Takeaways and Actionable Insights
1. Understanding Inclusions: What They Are & Why They Matter
Inclusions in metals are non-metallic particles or compounds that arise during the melting, refining, or casting processes. They primarily comprise:
Oxides
Sulfides
Silicates
Nitrides
Complex multi-phase compounds
Origins of Inclusions
Inclusions frequently originate from:
Raw materials: Impurities from iron ore, scrap steel, or alloy additions. For example, studies show that poor scrap sorting can increase inclusion frequency by up to 25% ([source](https://www.sciencedirect.com/science/article/pii/S0301679X19307113)).
Refractories: Reaction or erosion of vessel linings introduces foreign phases.
Process atmospheres: Ingress of gases such as oxygen, nitrogen, and sulfur create reaction products.
The Effects of Inclusions on Metal Performance
Strength, Ductility, and Toughness
Large or clustered inclusions often serve as stress concentrators or micro-crack initiators. A 2018 review in Metallurgical and Materials Transactions reported that a single, 25-micron non-metallic inclusion could halve the fatigue life of a bearing steel sample.
Machinability
While certain types, like manganese sulfides, improve chip breaking and tool life, uncontrolled inclusions accelerate tool wear, reducing manufacturing productivity. Precision studies from the World Steel Association highlight that reducing inclusion variation can improve tool lifetime by 20–40% in automotive manufacturing.
Corrosion Resistance
Inclusions may serve as initiation sites for pitting or stress corrosion, especially in high-chromium steels or welds. Clean steel is essential for chemical processing, marine, and medical implant applications.
Reliability and Life-Cycle Costs
Microstructural cleanliness is critical for high-stress industries. Airbus Group, for example, mandates strict inclusion thresholds for landing gear components. Even single failures can incur millions in liability and lost business.
Bottom line: Inclusions are silent destroyers that can sabotage performance, reputation, and profitability. Every reputable steel manufacturer—be it ArcelorMittal, Nippon Steel, or niche precision foundries—views “clean steel” as a strategic imperative.
2. The Science of Clean Melt: Fundamental Principles
Achieving ultra-clean steel is a science and an art, demanding process discipline and advanced materials knowledge.
Thermodynamics in Inclusion Control
Thermodynamic models, such as the Ellingham diagram, predict which inclusions form under specific chemical and temperature conditions. Engineers leverage these models to steer melt chemistry away from trouble spots, e.g., suppressing alumina formation in low-silicon steels.
Kinetics: Time, Mixing, and Removal
Even if inclusions can theoretically form, their removal depends on kinetic factors:
Mixing intensity: Promotes collision, agglomeration, and buoyancy-driven rise.
Residence time: Sufficient holding in the ladle or tundish allows for separation.
Slag-metal interface area: Directly correlates with removal rates; increased by gentle stirring.
Real-world example: One major Chinese steelmaker achieved a 15% reduction in hard oxide inclusions by optimizing argon bubbling patterns and extending residence times in ladle metallurgy ([IISI, 2021]).
Managing the Process Window
The process window embodies combinations of temperature, composition, and time that optimize cleanliness while balancing cost and productivity. Advanced plants use real-time computational models to ensure every heat stays within this window, reducing off-spec production to less than 1% ([SteelTimes, 2022]).
3. Key Parameters in Melt Shop Control
True cleanliness begins with controlling every factor that can seed or exacerbate inclusions. Let’s break down the most critical levers:
a. Raw Material Quality
Scrap Purity and Sorting
Tramp element control: Promise lower copper, tin, and zinc.
Pre-qualification: Use XRF (X-ray fluorescence) scanners for batch analysis.
Statistics: Plants converting to digitized scrap yards consistently report up to 10% cleaner melts and 6% less rework ([SSAB data 2022]).
Charge Ratios and Homogeneity
Consistency in the blend reduces unknown reactions, while erratic batching can increase inclusion variability.
b. Slag Practice
Slag Chemistry
Target low FeO for greater inclusion absorption.
Control basicity (CaO/SiO2 ratio) for optimal interface reactivity.
Case Study: POSCO found that adjusting slag basicity reduced CaO-Al2O3 inclusions by 18% in critical line pipe grades.
Slag Viscosity
Proper viscosity facilitates inclusion “float out” while preventing reentrainment—a Goldilocks zone aided by lime and fluorspar additions.
c. Ladle Metallurgy
Argon Bubbling and Stirring
Facilitates upward migration of tiny inclusions; advanced facilities use controlled gas flow to avoid surface reoxidation.
Deoxidation Sequence
The order and timing of deoxidizer addition—like aluminum and silicon—determine type and morphology of inclusions, critical for grades demanding high toughness.
d. Temperature Management
Superheat Control
Too low: Inclusion removal slows, increasing entrainment.
Too high: Erodes refractories, seeding new inclusions. Digital pyrometers and thermocouple arrays are now standard.
e. Pouring & Casting Conditions
Filters and Flow
Use of ceramic filters in the tundish/ladle improves cleanliness by trapping inclusions at the last moment.
Casting Velocity and Turbulence
Fast or turbulent flow can introduce mold powder, air, or reoxidation inclusions. Computational Fluid Dynamics (CFD) modeling is now routinely used to tune flow.
Every parameter must be monitored in context, within the robust process window tailored for each steel grade and product application.
4. Advanced Testing & Analytical Methods
Controlling inclusions is only half the battle; proving you did it—quickly, repeatably, and in production time—is the other half. No single test captures the full picture. The most reliable melt shops combine standards-based microscopy, at-line sensors, automated SEM/EDS, gas analysis, and high-frequency ultrasonics, then tie the data together with extreme-value statistics for decision-ready cleanliness control.
4.1 What the core standards actually measure
Cleanliness starts with shared yardsticks:
ASTM E45 defines macro/micro methods (manual and image analysis) to describe inclusion type, size, and distribution—still the most widely referenced baseline. ASTM International | ASTM+1
ISO 4967 uses standardized micrographic charts; it’s effective for wrought products but operator technique and subjectivity can limit reproducibility—so document prep and training matter. Iteh Standards+1
DIN 50602 (K-method) remains popular in Europe for severity indices (K values) and is often used alongside E45 to communicate expectations across suppliers. leica-microsystems.com+1
These chart-based ratings are fast for lot acceptance, but they’re 2D and composition-blind. Modern programs therefore add automated and chemistry-aware methods.
4.2 Gas/oxygen baselines: the fastest proxy for oxide populations
Track the gases that create or correlate with inclusions:
Total O, N, H by inert-gas fusion (LECO)—the workhorse snapshot for oxide, nitride, and hydrogen control; covered by ASTM E1019. Rising total oxygen (T.O.) is often the first sign of contamination or reoxidation. ASTM International | ASTM+1
Pair T.O. with targeted microscopy: studies show SEM + T.O. together characterizes inclusion families more effectively than either alone. ScienceDirect
4.3 Metallography & microscopy: from charts to chemistry
Classical LOM per E45 / ISO 4967 / DIN 50602—fast visual severity checks on polished sections. Good for trends and supplier agreements, limited for root-cause. ASTM International | ASTM+2Iteh Standards+2
Automated image analysis (ASTM E1245)—quantifies amount, number, size, and spacing of inclusions; removes operator bias and supports JK-style ratings. Antpedia+1
SEM/EDS with automated classification (ASTM E2142)—maps inclusion chemistry (e.g., Al₂O₃ vs. Ca-aluminates vs. spinel), size, morphology, and distribution to trace sources (refractory, slag, deoxidation sequence). Tools like ASCAT industrialized this approach. ANSI Webstore+1
4.4 3D truth: electrolytic extraction & tomography
Two-dimensional sections underestimate cluster size and misread morphology. When the stakes are high (bearing steels, pressure parts), add 3D:
Electrolytic extraction (EE) dissolves the matrix and lifts inclusions onto a filter for true 3D size and cluster analysis by SEM/EDS—far more accurate for maximum-size and morphology than 2D cross-sections. PMC+2J-STAGE+2
X-ray micro-CT can non-destructively visualize inclusion shapes and void linkages in 3D, complementing EE for development and failure analysis. ScienceDirect
4.5 Melt-phase & at-line sensors: decisions in minutes, not hours
Clean outputs require clean control during refining:
ZrO₂ electrochemical oxygen probes (e.g., Celox®)—real-time dissolved O in BOF/ladle enables precise pre- and post-tap deoxidation and slag practices; SLAC® variants read slag oxygen to reduce reoxidation risk. Heraeus Electro-Nite+2Heraeus Electro-Nite+2
Spark OES with Pulse Distribution Analysis (PDA/OES)—uses pulse-height statistics from the spark to rapidly infer inclusion type/size distributions on solid samples; powerful for at-line trend control and confirming Ca-treatment effects. Thermo Fisher Documents+2J-STAGE+2
“Lollipop” ladle samples—simple discs pulled during refining, then tracked by SEM to watch inclusion evolution through Ca treatment or RH; an industry-proven workflow. Thermo Fisher Documents+1
4.6 Non-destructive gates: high-frequency ultrasonics for “killer” inclusions
Chart ratings miss rare, large exogenous inclusions that cause catastrophic failures. That’s why many release plans add immersion ultrasonics at 10–50 MHz for bars, billets, and plates; the higher the frequency, the smaller the detectable inclusion—but with lower penetration, so scanning strategy matters. Standards in practice include A388 (forgings) and A578 (plates), while industry guidance highlights the frequency–penetration trade-off. fushunspecialsteel.com+2MaTestLab+2
Evidence from bearing and gear steels shows UT and SEM can reveal cleanliness differences that classic micro-ratings miss—making UT a valuable last line of defense. ovako.com
4.7 From data to risk: extreme-value statistics (EVS) & fatigue models
Clean steels fail from the largest indigenous inclusion, not the average. Two quantitative tools connect lab data to risk:
ASTM E2283—a standardized EVS method to estimate the distribution of maximum inclusion size in a product volume from metallographic measurements; it’s the common language for comparing heats/lots and setting release thresholds. ASTM International | ASTM
Murakami’s √area model—links inclusion projected area and matrix hardness to fatigue strength; widely used with EVS to predict endurance limits in bearing and high-strength steels. NIST Publications
Recent reviews and applications continue to validate EVS for clean steels (and note its limits for truly random exogenous inclusions—where UT is preferable). SpringerLink+1
4.8 A practical “cleanliness control loop” you can run every heat
Yard intake & blend: certify scrap/alloy lots; set target T.O./[O] activity envelopes for the grade. (Use IGF + historical E45/ISO baselines.) ASTM International | ASTM
Refining in control: probe dissolved oxygen and manage slag oxygen (Celox/SLAC) to minimize reoxidation; confirm with PDA/OES spot checks after deoxidation or Ca additions. Heraeus Electro-Nite+2Heraeus Electro-Nite+2
At-line evidence: pull lollipop samples at defined gates (end-LF, post-RH, pre-tundish) for SEM/EDS; watch families shift from hard Al₂O₃/spinel to liquid Ca-aluminates when treatment is effective. Thermo Fisher Documents
Release analytics: run E45/E1245 for documentation; apply E2283 EVS on development heats and critical production lots to bound √area_\max; escalate to 3D EE if clusters are suspected. Antpedia+1
Final gate: ultrasonic cleanliness scan on bars/billets/plates for low-probability, high-consequence exogenous inclusions before machining or shipment. gearsolutions.com
Bottom line: pair fast proxies (IGF, oxygen probes, PDA/OES) with chemistry-aware microscopy (SEM/EDS, automated image analysis), then quantify risk with EVS and screen for outliers by high-frequency ultrasonics. That’s the melt-shop control stack that keeps inclusions from sabotaging mechanical performance—and your margins. gearsolutions.com+3Blueprint-Bricks+3ANSI Webstore+3
5. Defining & Defending the Process Window
Think of the process window for melt cleanliness as a bounded “safe zone” in multi-dimensional space—chemistry, temperature, time, and flow—within which inclusions are (a) prevented from forming in the first place, (b) transformed into benign, liquid phases when they do form, and (c) efficiently removed before casting. The best shops don’t treat this as a static spec sheet; they run it as a living control envelope tied to real-time sensors, fast at-line analytics, and codified responses. In practice, that means four pillars: chemistry guardrails, slag/reoxidation control, thermal–hydrodynamic control, and a casting/operability guardrail to prevent nozzle events.
5.1 Chemistry guardrails: oxygen, aluminum, sulfur… and calcium timing
Dissolved oxygen & total oxygen are your cleanliness “vitals.” Keep dissolved O low and stable at end-LF/RH (and pre-tundish) so you don’t re-nucleate alumina during transfers. Zirconia-based oxygen probes (electrochemical sensors) are industry workhorses for fast dissolved-O reads; treat these signals as hard interlocks for deoxidation and transfer decisions. www2.irsm.cas.cz+1
Calcium treatment has a narrow window. Done right, it modifies hard Al₂O₃ into liquid Ca-aluminates (and oxy-sulfides) that float out and don’t clog. Done poorly—wrong addition timing, excess Ca relative to O/S, or insufficient inclusion exposure time—you trade alumina clogs for CaS-rich inclusions and fresh castability problems. Your window is set by steel composition, temperature, and the sequence/timing of Ca additions; treat timing as a first-class control variable, not an afterthought. Wiley Online Library+2MDPI+2
Model-assist the window. Modern inclusion evolution models (and plant-validated theses) show that the rate of Ca supply to inclusions and the melt’s oxidation state govern whether you land in liquid Ca-aluminate territory or stall on hard oxides. Use these kinetics to set your Ca targets and hold times, not just “kg/heat” rules of thumb. macsphere.mcmaster.ca+1
5.2 Slag & reoxidation guardrails: keep the interface “hungry,” not hostile
Your slag is the sink that “swallows” inclusions; its oxidation state and basicity decide whether it helps or hurts. Low FeO/MnO minimizes reoxidation; tuned basicity improves inclusion absorption. Plant-validated models and shop studies consistently flag slag oxidation and argon stirring intensity as top levers for the final inclusion count and size—use them to widen your window, not burn through refractories. macsphere.mcmaster.ca
5.3 Thermal–hydrodynamic guardrails: temperature bands and flow fields
Superheat is a double-edged sword: too low and you slow flotation; too high and you erode refractories, seeding exogenous inclusions. Keep it in a tight band and treat non-isothermal effects in the tundish as real—not just CFD niceties—because buoyancy and inlet temperature deltas reshape residence-time distributions (RTDs). MDPI
Engineer the tundish for flotation, not just level control. Weirs, dams, impact pads, and turbulence inhibitors (TIs) increase plug-flow volume, cut dead zones, and give micro- and macro-inclusions time and quiescent surfaces to separate. Multiple CFD/experimental studies show higher small-inclusion removal and better RTDs when weir–dam–TI combinations are tuned to the grade and throughput. Make these devices parametric settings in your window, not fixed hardware. MDPI+2SpringerLink+2
5.4 Casting/operability guardrail: the anti-clog envelope
Nozzle (SEN) clogging is the single most unforgiving way to “fall out” of your window. The risk spikes with undermodified alumina, turbulent reoxidation, and CaS precipitation when Ca/O/S ratios drift. Your guardrail is a mix of prevention (keep inclusions liquid/modifiable, control air aspiration, maintain gentle flow) and detection (watch slide-gate position vs. speed, pressure drop, and strand-to-strand asymmetry). ISIJ and AIST/CCC literature make it clear: clogging is a multi-cause phenomenon—build a multi-signal guardrail. J-STAGE+2ccc.illinois.edu+2
How to operate the window (playbook)
1) Define the envelope grade-by-grade.
Start from your failure modes (nozzle events, fatigue scatter, UT rejects). For each grade, lock in:
Chemistry bands: dissolved O before transfer; [Al] after kill; Ca addition timing/amount and target inclusion state; [S] strategy.
Slag bands: FeO/MnO ceilings and basicity range matched to the grade’s inclusion targets.
Thermal–flow bands: superheat at tap, at tundish, at mold; target RTD (plug-flow %) and dead-zone cap with your chosen FCDs.
Validate with development heats using SEM/EDS + EVS (from the previous section) until your bands separate “good” vs “risky” heats in real plant data. (The SEM/EDS trend lines will show Al₂O₃ → Ca-aluminate transitions when the window is right.)
2) Instrument the envelope with fast, trustworthy signals.
Electrochemical oxygen probes for dissolved-O interlocks at end-LF/RH and pre-tundish.
At-line checks after deoxidation/Ca (e.g., PDA/OES or rapid SEM spot maps) to confirm inclusion state before you commit metal to the caster.
Flow/RTD confirmation via CFD-driven setups and periodic tracer/PIV studies to keep weir–dam–TI configurations current to throughput and heat losses. www2.irsm.cas.cz+1
3) Codify “if-this-then-that” moves.
If dissolved-O rises above the grade’s ceiling pre-transfer: pause transfer, check slag FeO, re-deoxidize per playbook, retest.
If PDA/OES or SEM shows hard-oxide spikes post-kill: re-treat with Ca and extend hold/stirring for exposure time; do not open until a lollipop confirms liquid Ca-aluminate dominance. Wiley Online Library+1
If clog risk indicators (gate position vs. speed, strand imbalance) trend up in the first heats: increase SEN argon within limits, verify shroud seals, and reassess Ca timing vs. [S] to avoid CaS precipitation during cool-down. J-STAGE
If RTD degrades (dead-zone creep at higher throughput): re-tune weir/dam heights/positions or introduce a TI per the grade’s CFD map before increasing speed. SpringerLink
4) Digitize the window so it learns.
Treat the process window as a software object: ingest oxygen-probe time series, chemistry, PDA/OES, SEM/EDS features, tundish temperature/RTD estimates, and casting telemetry. Use soft sensors and drift-aware models (concept-drift is real when raw materials change) to keep your control limits honest and predictive rather than reactive. This is exactly where modern BOF/LF endpoint prediction and soft-sensor literature is heading; your melt shop can too. MDPI+1
Bottom line: a clean-steel process window isn’t a line in a spec—it’s a controlled zone maintained by sensors, tuned hardware (weirs/dams/TIs), disciplined Ca practice, and fast analytics. Run it like an active safety envelope, and nozzle events, micro-pit starters, and rework become rare, not routine. MDPI+2Wiley Online Library+2
6. From Yard to Melt: Real-World Impacts on Steel Cleanliness
Clean steel starts long before the tap—out on the pad, in the shredder, and on the scale. The way you spec, sort, dry, batch, and charge scrap determines whether your melt enters the ladle already “in the window” or arrives burdened with residuals, non-metallics, and moisture that no downstream tweak can fully erase.
6.1 Scrap taxonomy = residuals risk (and why specs matter)
Not all “steel scrap” is created equal. Prompt sheet/busheling tends to carry the lowest residuals; obsolete/shredded streams carry the highest variability (copper from motors/wiring, tin from coatings, mixed alloys, dirt). That’s why melt shops anchor contracts to ISRI specs (e.g., ISRI 211 shredded: magnetically separated, homogeneous iron/steel, free of non-metallics) and demand density/purity evidence up front. Writing to the spec is your first cleanliness control. isrispecs.org+1
Why it matters: residual elements like Cu/Sn/Sb/As concentrate at the surface during reheating and can cause surface hot-shortness—liquid embrittlement and cracking during hot work. Modern reviews show the acceptable Cu ceiling isn’t a single number; it shifts with grade, process route, and co-elements, often hovering around the ~0.2 wt% discussion point but moving up or down with Ni/Si additions and practice. Treat Cu/Sn as a managed envelope, not a fixed limit. Wiley Online Library+2DNB+2
6.2 Coatings, oils, and dirt: the hidden inclusion and slag tax
Coatings add chemistry and fume; oils/moisture add hydrogen and explosion risk; dirt/oxides inflate slag and burn energy. Studies and industry roadmaps note that plastics/rubber and copper fragments left in shredded streams raise dust/slag loads and degrade product quality; better scrap purity improves yield and lowers kWh/t. In short: every kilo of non-metal you charge returns as slag, dust, or defects. K1-MET - Metallurgical competence center+1
6.3 Galvanized reality: zinc doesn’t vanish—it moves
When you melt galvanized scrap, Zn volatilizes, leaves with the off-gas, and reports to EAF dust. That dust typically contains substantial Fe and Zn and must be treated (e.g., Waelz) to recover metals and manage residues—an environmental and cost consideration tied directly to yard mix. Managing the galvanized fraction is therefore a melt cleanliness and compliance lever. PMC+1
6.4 Moisture management: from safety to hydrogen control
Water is the enemy of molten steel. Wet scrap and trapped liquids drive steam explosions, while water and oils are also upstream sources of hydrogen pickup, which can manifest later as flakes/embrittlement in susceptible products. Guidance for foundries and steel plants is unambiguous: keep charge materials dry, control humidity around hot metal, and treat moisture as a critical-to-quality variable. IFC+1
Preheating helps. Continuous scrap-preheat systems (e.g., Consteel-type) remove moisture, stabilize charge temperature, and reduce electricity, oxygen, and electrode consumption—benefits that flow through to cleaner thermals and more stable slags. ACEEE
6.5 Yard QA gates that actually move the needle
Radiation portals at the gate (plus handheld RIIDs when flagged) prevent catastrophic contamination events—now standard practice at larger yards and mills. Environmental Protection Agency
Sensor-based sorting: XRF and LIBS units separate Cu/Brass/Zn and identify alloy families in milliseconds; pairing these with eddy-current and density steps upgrades obsolete streams into melt-friendly lots with fewer residual surprises. STEINERT+2SGM Magnetics+2
Document the lot: batch-level chemistry snapshots (XRF/LIBS) and contamination photos, attached to scale tickets, create the data handshake your melt shop needs to enforce the process window from the first bucket.
6.6 Charge design: cleanliness by the basket
Charge order affects turbulence, air aspiration, fume bursts, and reoxidation. Prepare baskets by grade and density, avoid “fluff pockets,” and distribute high-residual or galvanized pieces intentionally rather than in clumps. Many safety/operations guides codify this basic but too-often skipped discipline: prepare the basket to the recipe for the target steel. OurGov.Live
6.7 When scrap alone can’t hit the window: dilute and blend
For ultra-clean or residual-sensitive grades, mills blend DRI/HBI/pig iron into the charge to dilute residuals and stabilize chemistry—an increasingly common lever as residuals rise in global scrap. Industry forums and analyses repeatedly highlight DRI’s role in enabling high-grade EAF steel by lowering the residual burden. AIST
6.8 KPIs that tie the yard to melt cleanliness
If you don’t measure it, you’ll re-melt it. Track:
Inbound purity (% non-metal, moisture, galvanized fraction) vs. slag rate and EAF energy—higher-quality scrap consistently yields lower kWh/t and higher metallic yield. SpringerLink
Residuals in the charge (XRF/LIBS lot means) vs. Cu/Sn in steel and hot-shortness incidents downstream; use the literature-backed understanding that Cu/Sn effects are context-dependent to set dynamic purchasing guardrails, not static cutoffs. DNB
Moisture incidents vs. H content/UT rejects on sensitive products; preheat and storage controls should move both in the right direction. IFC
Bottom line: The cheapest place to control inclusions and prevent clog-prone oxides isn’t your tundish—it’s your yard. Write to ISRI, sort with XRF/LIBS, dry aggressively, charge by recipe, and blend wisely. Do those five things, and your ladle-to-caster “window” gets wider, your dust and slag get lower, and your inclusion analytics start telling a far friendlier story. SpringerLink+3isrispecs.org+3SGM Magnetics+3
7. Quality Assurance: Integrating Science Into Industrial Tech
A clean melt isn’t just a chemistry achievement—it’s a systems achievement. The shops that win on cleanliness wire sensors, lab analytics, casting telemetry, and release rules into a single, operator-runnable flow. Think of QA not as a “final check,” but as an always-on control system that spans from scrap intake to billet/bloom/plate certification.
7.1 The control backbone: make QA computable, not anecdotal
Start by mapping your plant to an industry-standard integration model so quality data flows cleanly between layers:
Level 0–2 (process/automation): probes, analyzers, caster & ladle events
Level 3 (MES/QMS): routing, genealogy, quality logic, hold/release gates
Level 4 (ERP): orders, specs, customer promises
This layering is formalized in ISA-95 (IEC 62264) and gives you a shared language to put melt cleanliness rules where they belong—Level-3 quality—while consuming Level-2 signals in real time. isa.org+1
Digital-first steel plants already run this way: modern QMS/MES packages orchestrate multiple melt shops, casters and finishing lines, enforcing grade rules and closing the loop between sensors and release. Case studies in AIST’s digitalization series show how centralized quality logic ties together disparate plants under one control canopy. AIST+1
7.2 What goes into the loop: the “cleanliness signal stack”
Your loop is only as strong as its signals. The essentials:
Dissolved oxygen & slag oxygen (real time): ZrO₂ oxygen probes (Celox®) at BOF/LF/RH and SLAC® for slag FeO+MnO tell you if deoxidation took and whether the slag is “hungry” or reoxidizing your steel. These are the frontline interlocks that prevent nozzle trouble and pinholes before the caster sees metal. Heraeus Electro-Nite+2Heraeus Electro-Nite+2
At-line chemistry & inclusion proxies: Spark OES is the workhorse for composition; with Pulse Distribution Analysis (PDA/OES) you can rapidly infer inclusion families/size trends on solid samples—perfect for post-kill and post-Ca-treatment checks. Hitachi High Tech Analytical Science+2KTH Diva Portal+2
Lab-grade inclusion truth: SEM/EDS maps the chemistry and morphology of inclusions (development, deviations), while EVS per ASTM E2283 converts 2D measurements into a risk-aware estimate of maximum inclusion size—the number designers actually care about. PMC+2dl.astm.org+2
NDT gates: Ultrasonic testing (UT) on bars/billets/plate captures rare, exogenous killers. Acceptance and procedure for plates are standardized in ASTM A578/A578M and are being referenced even in adjacent safety regimes. ASTM International | ASTM+2Haisms+2
7.3 From data to decisions: encode the release logic
Once the signals exist, codify decisions at Level-3 so operators execute playbooks, not gut feels.
Interlocks & holds.
If [O]diss above grade ceiling at end-LF: auto-hold transfer, trigger re-deoxidation recipe, retest; only then release to tundish. Heraeus Electro-Nite
If PDA/OES or spot SEM shows hard-oxide resurgence post-kill: require Ca re-treatment and minimum exposure/hold time before opening. KTH Diva Portal
If SLAC® reads a “hot” slag (high FeO+MnO): apply modifier additions per rule set; re-probe before casting. Heraeus Electro-Nite
Cleanliness KPIs drive release.
Development and critical lots use E2283; release limits are set on L_max (or √area_\max with Murakami correlation) rather than average ratings. This aligns QC with fatigue and defect risk. PMC
For plates, configure UT acceptance to A578 class levels aligned to customer service severity. ASTM International | ASTM
7.4 Close the loop during the heat: real-time triage
QA that waits for the lab is QA that arrives too late. With live probes and fast at-line checks, you can steer the heat:
Probe-steered deoxidation: use on-heat oxygen results to size Al/Si/Mn additions and avoid both reblows and over-kills—saving cost and preventing alumina burst nucleation. Heraeus Electro-Nite
Caster protection: trend slide-gate position vs. throughput and pressure drop; if clog risk indicators rise, rules can bump SEN argon, verify shrouds, or—worst case—reroute to safer strands, all under MES authority. (AIST’s digital transformation notes emphasize embedding such responses in software, not shift lore.) AIST
7.5 Traceability: genealogy that engineers can trust
Every bucket, lollipop, probe read, OES spark, SEM map, UT scan and operator action must attach to material genealogy: Heat → Ladle → Tundish → Strand → Cast → Product ID. This is standard MES/QMS territory under ISA-95 and is what lets you prove compliance grade-by-grade and customer-by-customer—without spreadsheet archaeology. isa.org
7.6 Soft sensors, models, and “learning limits”
Two accelerators make QA smarter over time:
Soft sensors estimate unmeasured states (e.g., tundish RTD/plug-flow fraction) from easily captured signals (temps, flows, throughputs), feeding guardrails without expensive instrumentation. AIST’s digitalization work highlights exactly this pattern—calculated indicators driving quality. AIST
Learning limits adjust spec guardrails (e.g., Ca timing windows, dissolved-O setpoints) as raw material mix shifts, preventing silent drift. EVS outcomes and UT reject maps are the teacher; MES writes the new limits.
7.7 Implementation milestones (what “good” looks like in 90–180 days)
Wire the vitals: dissolved-O probes at end-LF/pre-tundish; SLAC® in secondary; PDA/OES at-line for post-kill checks; UT routing for critical products. ASTM International | ASTM+3Heraeus Electro-Nite+3Heraeus Electro-Nite+3
Put rules in MES/QMS: formalize interlocks/holds and release logic (E2283/UT classes), tied to heat genealogy per ISA-95. isa.org
Prove it with one pilot grade: collect SEM/EDS + EVS for 20–30 consecutive heats, compare L_max and nozzle events before/after rule-in—your business case in one chart. PMC
Scale with dashboards: a single “Cleanliness Control” view showing probe traces, PDA/OES flags, EVS status, and caster health—so supervisors decide in seconds, not hours. (Multiple multi-plant QMS case studies demonstrate this centralized paradigm.) AIST
Bottom line: industrial QA for cleanliness is a living control system. Wire probes and fast analytics into MES/QMS (ISA-95), encode interlocks and release rules (E2283, A578), and let operators drive by signals—not stories. That’s how you turn “clean steel” from an aspiration into an everyday outcome. PMC+4isa.org+4Heraeus Electro-Nite+4
8. Takeaways & Actionable Insights
Clean steel is the outcome of disciplined inputs, live sensors, fast analytics, and encoded decisions—run as one system. Here’s the distillation of everything so far into moves you can execute on day one, week four, and quarter two.
8.1 What to standardize (today)
A common language for “clean.” Lock in chart-based inclusion ratings for lot acceptance (ASTM E45; ISO 4967) and make sure prep, etch, and operator training are documented to cut subjectivity. Use the charts for speed; don’t mistake them for root-cause tools. ASTM International | ASTM+1
A risk metric designers trust. For development and critical lots, add ASTM E2283 extreme-value analysis (EVS) so you’re controlling maximum inclusion size—what drives fatigue and catastrophic outliers—not just averages. ASTM International | ASTM+1
8.2 What to instrument (this week)
Oxygen, everywhere it matters. Deploy zirconia oxygen probes (e.g., Celox®) at end-LF/RH and pre-tundish; treat dissolved-O interlocks as hard gates for transfer and deoxidation sequencing to head off alumina nucleation, pinholes, and nozzle events. Read time is seconds; the payoff is immediate. Heraeus Electro-Nite+1
Fast inclusion proxies at the line. Add spark OES with Pulse Distribution Analysis (PDA/OES) to fingerprint inclusion families (hard Al₂O₃ vs. Ca-aluminate, spinel, etc.) in minutes after kill or Ca-treatment—perfect for “go/no-go” before you open to the caster. J-STAGE+1
A non-destructive backstop. For plates/forgings and safety-critical stock, route through ultrasonic gates (plates per ASTM A578; forgings per ASTM A388). These catch rare, large exogenous defects the micro charts can’t. ASTM International | ASTM+1
8.3 What to tune (this month)
Calcium treatment as a timed reaction, not a dosage. Your clean window is set by dissolved-O, S, temperature, and sequence. Verify conversion of hard alumina to liquid Ca-aluminates at-line (PDA/OES quick check; SEM/EDS audits). If you see CaS-rich or unmodified oxides, you’re mistiming additions or starving exposure time. J-STAGE
Slag that swallows, not seeds. Keep FeO/MnO low and basicity tuned so the slag remains a sink for inclusions rather than a source via reoxidation. Confirm with slag-oxygen readings where available. Pyrometallurgy
Thermal–flow reality. Superheat bands, tundish RTD, and inlet dampers/weirs/dams/turbulence inhibitors must be treated as parameters of the cleanliness window, not fixed hardware. Validate with occasional tracer/CFD-informed adjustments. Heraeus Electro-Nite
8.4 Yard-to-melt discipline (the cheapest fix you’ll ever make)
Spec the scrap. Buy to ISRI 211 (or grade-appropriate equivalents) with density and contamination terms, and demand lot documentation. Residuals (Cu/Sn) and dirt/moisture are inclusion and hot-shortness taxes you will pay later. isrispecs.org
Preheat pays twice. Continuous scrap preheating (e.g., Consteel®) removes moisture, stabilizes charge temperature, cuts 70–110 kWh/t from typical EAF power, and reduces fume bursts—better thermals, cleaner slags, calmer flow. e3tnw.org
Know where zinc goes. Galvanized inputs drive Zn into EAF dust; plan recovery/handling accordingly and don’t pretend it disappeared. Typical EAF dusts carry substantial Fe with Zn up to double-digit percentages. PMC
8.5 Encode the release logic (so operators drive by signals, not stories)
Put rules at Level-3. Use an ISA-95/IEC 62264-aligned MES/QMS so live probe data, PDA/OES flags, lab SEM/EDS, and UT results roll up to automated holds/releases. If dissolved-O is above the grade ceiling, transfers don’t open. If PDA/OES shows hard-oxide resurgence, Ca re-treat + minimum exposure is mandatory. isa.org
Make genealogy bullet-proof. Every heat → ladle → tundish → strand → product inherits its sensor and lab record, so customer certs cite facts, not recollections. (This is exactly what ISA-95 was built to standardize.) Siemens Digital Industries Software
8.6 30-60-90 day roadmap (lean but real)
Day 0–30: Wire oxygen probes at end-LF and pre-tundish; set interlocks. Stand up PDA/OES at-line after deoxidation/Ca. Route plates/forgings through A578/A388 gates. Baseline with E45/ISO 4967 on two pilot grades. ISO+5Heraeus Electro-Nite+5J-STAGE+5
Day 31–60: Encode the if-this-then-that logic in MES (ISA-95 terms), add slag-oxygen or periodic checks, and run EVS (E2283) on your pilot grade to set risk-based release thresholds. isa.org+1
Day 61–90: Tundish tuning (weirs/dams/TIs) to improve RTD; begin scrap preheat/handling trial and enforce ISRI 211 inbound QA with density/contamination photos. Track yield, kWh/t, nozzle incidents, and EVS L_max. e3tnw.org+1
8.7 KPIs that prove it’s working
Process KPIs: dissolved-O at pre-tundish within band; PDA/OES “liquid Ca-aluminate” signature after treatment; slag FeO/MnO within target; superheat at tundish stable. (All trended in MES.) Heraeus Electro-Nite+1
Quality KPIs: EVS L_max trending down on pilot grades; UT reject rate down and defect classes shifting from exogenous to negligible; SEM/EDS audits show fewer hard-oxide clusters. Antpedia+1
Cost/ops KPIs: kWh/t and electrode/oxygen consumption falling with preheat; slag rate and dust tonnage per heat aligned to scrap mix; fewer nozzle interventions per 100 heats. e3tnw.org+1
8.8 Failure signatures & fast fixes
Early-heat gate creep / rising pressure drop at SEN: you’re carrying hard alumina; check dissolved-O interlocks and Ca timing; re-treat and extend hold for inclusion exposure. Heraeus Electro-Nite
Pits/pinholes on as-cast billet: watch dissolved-O spikes and slag oxidation; adjust deoxidation sequence and re-probe before opening. Heraeus Electro-Nite
UT finds laminar reflectors but charts look “okay”: you’ve hit exogenous defects; tighten refractories/slag practice and add filtration/flow quieting; remember UT (A578/A388) is your last-line guard. ASTM International | ASTM+1
The executive punch-list
If you only do five things, do these:
Buy to ISRI and dry the charge (preheat where possible).
Interlock transfers on dissolved-oxygen and time your Ca, don’t just dose it.
Fingerprint inclusions at-line with PDA/OES; audit with SEM/EDS.
Release on risk using EVS (E2283) and UT where safety demands it.
Run the rules in an ISA-95 MES/QMS, with genealogy and dashboards that everyone can see. isa.org+6isrispecs.org+6Heraeus Electro-Nite+6
That’s the system that turns “cleanliness” from a poster on the wall into predictable output, lower kWh/t, fewer nozzle events, and tighter fatigue scatter—grade after grade, shift after shift.
Connect
Your trusted partner for scrap metal procurement.
CONTACT
About
haroon@tdcventures.com
+1-307-655-7593
© 2025. All rights reserved.
NEWSLETTER