Predictive Models for Donation/Take-Back Peaks
Discover how predictive models help retailers and municipalities forecast donation and take-back surges, prevent overflow, and optimize circular economy operations with AI, real-time data, and workflow automation.
AI & DIGITAL ENGAGEMENT IN SUSTAINABILITY
Introduction: Why Predicting Donation and Take-Back Peaks Matters Now
In 2026, donation and take-back systems sit at the intersection of retail returns, reuse, recycling, repair, and public policy. What used to be treated as a back-end nuisance is now a front-line business and infrastructure issue. Global waste volumes are rising faster than many local systems can absorb. The World Bank’s 2026 What a Waste 3.0 says the world generated 2.56 billion tonnes of waste in 2022 and, without major policy and investment shifts, that figure could reach 3.86 billion tonnes by 2050. At the same time, cities already account for up to 50% of global waste, while also carrying much of the responsibility for circular economy delivery.
That backdrop changes the role of forecasting. Peak prediction is no longer about making a warehouse slightly more efficient. It is about preventing overflow, avoiding missed collections, protecting customer experience, preserving reusable goods before they degrade, and proving that circular programs can work at scale. In retail, returns alone have become large enough to reshape operations strategy. NRF’s 2025 data shows retailers expect returns to total $849.9 billion, with 19.3% of online sales returned. UPS and Happy Returns add that 81% of consumers read return policies before purchase, 71% say a poor returns experience makes them less likely to shop again, and 64% of retailers say improving returns capabilities is a priority within six months.
For circular programs, that means one thing. If you cannot see peak flows coming, you cannot run reuse, repair, take-back, or donation programs with consistency. You react late, bins fill up, staffing gets stretched, transport costs spike, reusable items get damaged, and citizens or customers lose trust. Predictive models change that sequence. They let teams shift from “How do we deal with this surge?” to “What will happen next week, tomorrow, or this afternoon, and what should we do before it hits?”
2. What a Donation or Take-Back Peak Actually Is
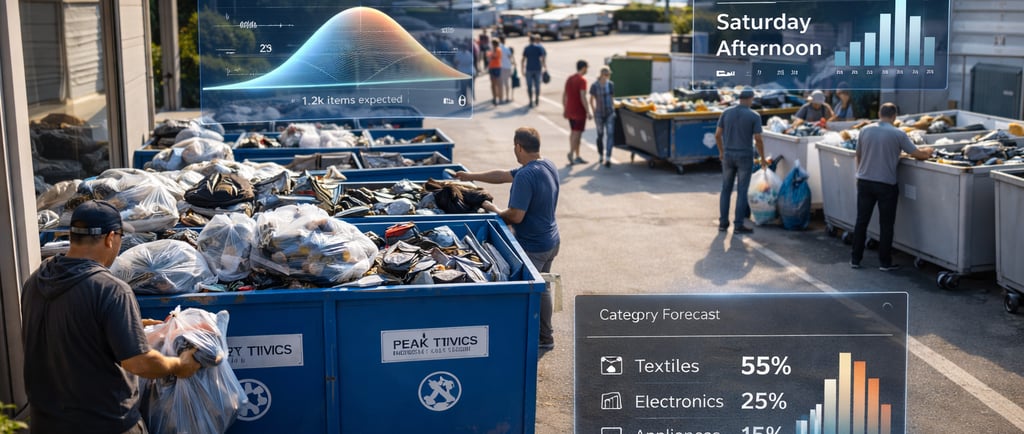
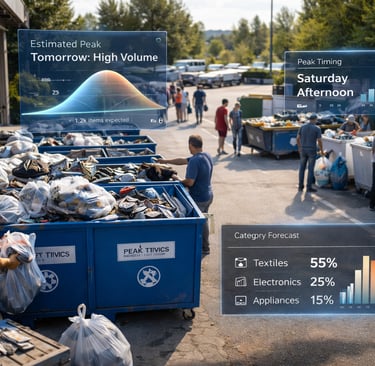
A peak is not just a busy day. It is a short period when incoming volumes rise above normal operating capacity or above the level that standard staffing, storage, transport, and sorting plans were built to handle. In donation and take-back systems, peaks are often uneven, localized, and category-specific. A neighborhood can experience a textile surge after a seasonal cleanout. A retailer can see a spike in appliance haul-away after a holiday sales push. An electronics program can be flooded when a new device launch, rebate, or regulation nudges consumers to clear old stock from their homes.
That matters because not all peaks are equal. Some are volume peaks, where too much material arrives at once. Some are composition peaks, where the mix changes and creates extra handling difficulty, such as a higher share of damaged textiles, mixed electronics, or oversized furniture. Some are quality peaks, where reuse potential falls because items arrive late, wet, dirty, incomplete, or badly packed. The best predictive systems do not just ask, “How much is coming?” They ask, “What is coming, where is it coming from, when will it arrive, in what condition, and what will that do to labor, storage, resale, recycling yield, and service levels?” That is the level where forecasting starts to produce real operational value.
3. Why Peaks Are Becoming Sharper in 2026
Several forces are making these surges more frequent and harder to manage. The first is simple volume. Waste generation is climbing, while many systems still lack collection coverage, sorting capacity, or usable data. The second is policy pressure. In Europe, textile rules have tightened fast. The EEA states that EU Member States have had to put separate collection systems in place for textiles starting in 2025. It also reports that EU citizens consumed 19 kg of textiles per person in 2022, while the EU generated 6.94 million tonnes of textile waste, or about 16 kg per person, and 85% of household textile waste was still not collected separately in 2022. The European Commission’s repair directive, adopted in 2024, must be applied by Member States from 31 July 2026, which will further push repair and return activity into mainstream operations.
The third force is category growth in hard-to-manage streams. E-waste is a clear example. UNITAR and ITU report that the world produced a record 62 million tonnes of e-waste in 2022, with only 22.3% documented as properly collected and recycled, and the total is on track to reach 82 million tonnes by 2030. Electronics take-back is exactly the kind of stream where peak forecasting matters, because product launches, household upgrades, repair barriers, and replacement cycles can trigger sharp surges in specific places and periods.
The fourth force is consumer behavior. Returns, buy-back, resale, and convenience-led drop-off expectations are now part of the same customer journey. IKEA’s buy-back and resell service turns used furniture into store credit and resale inventory. Best Buy offers paid haul-away and recycling for large products. These programs extend product life and keep materials in circulation, but they also create inbound flows that have to be forecast, staffed, routed, and sorted with much more precision than traditional waste systems ever needed.
4. The Signal Stack Behind Peak Forecasting
Accurate models are built on signal depth, not just historical averages. Historical inbound volume is still the base layer, but in 2026 it is not enough on its own. Donation and take-back peaks are driven by a stack of internal and external signals that interact with each other. Internal signals include POS sales, promotion calendars, returns authorization data, loyalty activity, app behavior, call center logs, store footfall, staffing rosters, prior overflow incidents, and transport lead times. External signals include weather, holidays, school calendars, local events, housing turnover, tourism patterns, product launches, and policy or fee changes. Research in waste forecasting keeps pointing in the same direction: models improve when they account for temporal patterns, socioeconomic conditions, and site-specific context rather than relying on broad averages alone.
This is especially important because household behavior is rarely linear. The Recycling Partnership’s 2024 findings show that only 21% of U.S. residential recyclable material is captured, with 76% lost at the household level. That gap is not just an infrastructure issue. It is also a timing and behavior issue. People respond to convenience, clarity, incentives, and local conditions. If participation is uneven, then incoming volumes to donation and take-back channels will also be uneven. That is why forecasting systems need behavioral data, not just tonnage logs.
In practice, the strongest models treat peaks as a pattern recognition problem across time, place, category, and user behavior. A good system learns that post-holiday apparel cleanouts behave differently from end-of-lease furniture returns. It learns that a rainy weekend can suppress drop-offs in one program and concentrate them into Monday. It learns that a product recall, a school drive, or a rebate campaign can create abnormal surges that standard seasonal logic will miss. Once those signals are linked, peak prediction becomes much more than time-series math. It becomes operational intelligence.
5. Sector by Sector, Why the Use Case Is Different
Apparel and textiles need forecasting because volume is high, item quality changes fast, and regulation is getting tighter. The EEA’s latest data shows both consumption and waste remain high, while separate collection and sorting capacity still lag. That means a surge in textile take-back is not automatically a success. If it arrives in the wrong place, at the wrong time, without enough sorting or resale capacity, it can still end in low-value channels.
Electronics need forecasting because value density, hazard profile, and disassembly complexity are high. UNITAR’s e-waste data makes the scale problem obvious, but the operational challenge is even sharper. One surge of laptops, phones, cables, printers, and small appliances can strain storage, testing, data wiping, reuse triage, and compliance processes all at once. In that setting, a wrong forecast does not just create congestion. It can destroy recovery value.
Furniture and bulky goods need forecasting because they consume space immediately. Programs like IKEA’s buy-back and resale create strong circular upside, but bulky products punish weak planning. Storage fills quickly, transport windows are harder to recover, and resale value can fall if goods sit too long or are handled badly.
Municipal and nonprofit donation systems need forecasting because trust is fragile. Overflowing bins, missed pickups, and inconsistent communication discourage participation. Since cities already carry large waste burdens and circular economy goals are increasingly tied to public performance, local governments and their partners need models that can protect service reliability, not just annual targets.
6. What Good Predictive Models Look Like in Practice
The strongest programs do not rely on one model for every decision. They use a forecast stack. A short-range model predicts site-level surges over the next 24 hours to 14 days so teams can adjust staffing, transport, and messaging. A medium-range model supports weekly and monthly planning for campaigns, storage, repair capacity, and resale throughput. A scenario layer tests shocks such as promotional pushes, regulatory changes, weather events, or product launches. That multi-horizon structure matters because operational decisions have different lead times. A truck route can change tomorrow. A sorting contractor or extra warehouse space may need weeks.
Model choice should follow the problem, not fashion. For some sites, strong baseline models with clean seasonal features and event calendars will outperform more complex systems. For others, especially multi-site networks with sensor feeds or volatile return behavior, machine learning methods can capture non-linear patterns better. Recent waste-forecasting literature shows AI-based models frequently outperform traditional approaches when enough contextual data is available, but the win comes from data quality and problem framing as much as from algorithm choice.
The most important design principle is that predictions must be tied to action thresholds. A forecast is useful only when it tells a team what to do next. That can mean opening overflow capacity, moving collection earlier, sending a segmented reminder, pausing a promotion, rerouting reusable items to a higher-value channel, or adding staff to intake and triage. Forecasting without response design is just reporting earlier. Forecasting with response design becomes a control system.
7. The Operating Model Behind the Forecast
Peak prediction succeeds or fails in the handoff from analytics to operations. That handoff needs four things. First, clear ownership. Someone has to own the forecast, someone has to own the response, and someone has to own the feedback loop. Second, site-level visibility. National averages are almost useless when one store, district, or depot tips into overflow while another stays quiet. Third, category-aware routing. Reusable goods, repairable goods, recyclable goods, and waste should not follow the same path by default. Fourth, communication that reaches the right user at the right time, because behavior changes load patterns.
This is where many programs still fall short. They can report what happened last month, but they cannot connect forecasted peaks to labor schedules, local logistics, customer messaging, and downstream recovery channels. The gap is costly. The World Bank notes that the economic costs of poorly managed waste regularly exceed the cost of operating proper systems, while retail returns data shows the customer side of the same issue. When inbound flows are mishandled, the damage shows up as higher service costs, lower recovery value, and weaker loyalty.
8. The Foundation for the Next Stage
By this point, the case for predictive donation and take-back modeling is clear. Volumes are growing. Policies are tightening. Consumer expectations are rising. Reuse and repair systems are moving into the mainstream. Yet most organizations still have fragmented data, uneven local visibility, and response plans that start too late. That is exactly why the next stage matters.
Once the foundation is in place, the work moves from “Why forecast?” to “How do we build the operating stack around the forecast?” That is where the real performance gains start to appear: unified data infrastructure, live analytics, behavior-aware engagement, workflow automation, and feedback systems that keep getting smarter over time. In other words, the natural next step is the five-layer distribution and reuse toolkit, followed by a hard look at the market gaps that still separate basic programs from the teams that are actually turning peak prediction into circular economy leadership.
9. Five-Layer Distribution & Reuse Toolkit for Donation/Take-Back Forecasting
Creating powerful predictive models for donation and take-back surges is only the starting point—the real strategic value lies in a well-orchestrated toolkit that equips retail, municipal, and waste-tech teams to act across the entire distribution and reuse ecosystem.
Let’s break down the essential five-layer toolkit for robust donation/take-back forecasting:
Layer 1: Unified Data Infrastructure
Every effective predictive model draws from a unified data infrastructure—centralizing information from POS systems, recycling bins, digital app analytics, community events, and weather APIs. This single source of truth removes blind spots and enables true end-to-end insight.
Best Practice: Build an integration hub with open APIs, so data from in-store and online engagement, local logistics, and community calendars flows seamlessly into the forecasting engine.
Emerging Trend: More municipalities and large retailers are investing in “circular data lakes,” enabling entity-level analysis across all streams and reducing data fragmentation. Amazon’s AWS Clean Rooms and Microsoft’s Sustainability Cloud exemplify this trend.
Layer 2: Real-Time Analytics & Visualization
Live dashboards unlock operational agility. Stakeholders—from logistics coordinators to campaign planners—should access real-time metrics like predicted vs. actual surges, nudge open rates, overflow risk, and resource allocation recommendations.
Case Example: A multi-state grocer uses Power BI to surface donation peak alerts directly to store managers, resulting in a 40% drop in bin overflows and overtime costs in just six months.
Pro Tip: Invest in dashboard tools that support both high-level scorecards (for executives) and granular, site-level analytics (for operations).
Layer 3: Adaptive Nudge Engine
An intelligent nudge engine tailors engagement tactics by user segment and predicted peak. This includes dynamic push notifications, personalized rewards, gamification, and cross-channel communication, all flowing from model insights.
Fact: According to a 2023 Accenture survey, programs using AI-personalized nudges reported a 30% higher rate of recycling participation, especially among younger digital natives.
Future Direction: Integration of conversational AI (think: chatbots and voice assistants) will further personalize the experience, addressing questions, managing FAQs, and guiding people through complex recycling tasks in real time.
Layer 4: Workflow Automation & Staffing Optimization
Flagging a peak is only valuable if your team can respond. This layer automates downstream actions based on model outputs—for example, scheduling extra pickups, auto-ordering bins, dynamically assigning staff, or even templating social posts about a surge.
Case Study: One national electronics retailer implemented automated shift scheduling linked to donation forecasts, reducing missed pickups by 52% year-over-year.
Best-in-Class Tactic: Pair operational alerts (via Slack or SMS) with automated task lists that assign individual responsibilities during surge events.
Layer 5: Closed-Loop Feedback & Continuous Learning
Finally, insights must flow back into the model. Every mispredicted peak, missed engagement, or operational bottleneck is an opportunity for system improvement—driving retraining, new feature engineering, or revised campaign strategy.
Statistic: Continuous learning loops accelerate model accuracy by up to 15% (McKinsey, 2022), while iterative campaign testing (A/B tests on digital nudges) rapidly increases engagement conversion.
Competitive Edge: Relying on a closed-loop system ensures both the recycling program and its underlying AI become more adaptive, user-centered, and impactful over time.
10. Competitive Differentiation: Market Gaps & Our Upgrades
The landscape of predictive donation and take-back forecasting is rapidly evolving as organizations embrace digitization and AI. Yet, several persistent gaps separate truly advanced teams from the rest. Here’s how a robust, AI-powered approach stands out:
Market Gaps (and Pain Points):
Manual Planning Dominates: Many programs still rely on static rules or staff intuition, missing nuanced digital and external signals that drive real peaks.
Disconnected Data Silos: Most retailers and municipalities lack a unified data backbone—POS, app analytics, campaign logs, and logistics data live in separate systems, impeding accurate forecasts.
Primitive Nudges: Blanket reminders, static email blasts, or generic in-app notifications often cause user fatigue and miss the moment of greatest impact.
Limited Scenario Modeling: Few solutions incorporate real-world variables like weather, local events, or product launches—leading to frequent over- or under-prediction.
Weak Impact Tracking: Many platforms monitor broad recycling metrics but fail to connect digital engagements directly to operational and sustainability outcomes.
Our Upgrades, Advantages, and Future Trends:
Multimodal Data Integration:
Leading-edge solutions unify every relevant data stream—digital engagement, external events, retail operations, and community context—delivering richer, far more accurate peak forecasts.
Example: By integrating weather and school calendars, a Midwest city predicted school-supply recycling spikes, optimizing throughput and reducing overflow by 33%.Adaptive Engagement Ecosystem:
Instead of static digital nudges, an advanced AI engagement system uses behavioral segmentation and predictive timing for hyper-personal prompts, maximizing conversion and reducing nudge fatigue.Scenario-Based AI Modeling:
Modern platforms leverage ensemble machine learning with scenario simulation, adapting to both expected and black-swan events (such as product recalls or community drives).Closed-Loop Measurement:
Results matter—so top solutions tie every digital action (app open, coupon use, nudge click) to real-world outcomes (actual returns, full bins, resource usage), creating a quantifiable impact audit trail.Scalability & Customization:
The ideal approach scales from a single store or neighborhood to national, multi-site, or even international use cases—with customizable segmentation for locale, product type, or demographic needs.Roadmap for Futureproofing:
Next-gen take-back forecasting will leverage IoT-enabled bins, edge computing for hyper-local prediction, and generative AI for simple, auto-generated campaign content—further closing the gap between model insight and on-the-ground action.
What This Means for Retailers, Waste-Tech, and Municipal Leaders:
Retail: Fewer customer service failures, optimized campaign ROI, and measurable circularity metrics that attract sustainability-conscious shoppers.
Municipal: Enhanced citizen trust, reduced waste management costs, and progress toward zero-landfill or decarbonization goals—grounded in transparent, data-driven plans.
Waste-Tech & Startups: Faster product-market fit, high-impact case studies, and competitive advantage in a green-tech landscape where performance, not hype, wins contracts.
Conclusion: Making Peak Prediction a Catalyst for Circular Economy Leadership
Predictive models for donation and take-back peaks have shifted from an innovation experiment to an operational imperative for the circular economy. By combining AI engagement, robust data ecosystems, and digital behavior change tactics, retailers, municipalities, and waste-tech innovators can move from reactive waste management to proactive, high-impact circular action.
As market expectations, regulations, and consumer demands rise, the capability to forecast—and quickly mobilize around—recycling surges will define leaders in sustainability and customer experience. The journey doesn’t end at model deployment; it thrives on relentless data integration, engagement innovation, and closed-loop learning.
If you’re aiming to accelerate your impact—cut overflows, boost participation, streamline costs, and build a loyal planet-first audience—now is the moment to invest in, optimize, and scale your predictive engagement playbook.
Ready to future-proof your recycling, donation, or take-back program? Let’s connect to design the data-driven, AI-empowered solution you need.
Connect
Your trusted partner for scrap metal procurement.
CONTACT
About
haroon@tdcventures.com
+1-307-655-7593
© 2025. All rights reserved.
NEWSLETTER