Water Recycling Loops: From Quench to Wash Bays
Discover how closed-loop water recycling from quench to wash bays cuts freshwater use & slashes GHG emissions. See LCA-backed case studies & ROI data for heavy industry.
WASTE-TO-RESOURCE & CIRCULAR ECONOMY SOLUTIONS
Why Water Recycling Loops Matter Now
If you manage an energy-intensive facility today, water is one of your biggest hidden climate variables. It affects energy, emissions, production uptime, and license to operate, all at once.
Globally, industry uses just under 20 percent of all freshwater withdrawals. In many developed economies, industry and energy together account for more than 40 percent of withdrawals. World Bank+2Gallagher+2
At the same time:
Water demand is rising in almost every region. World Bank
Climate change is making droughts and floods more frequent and more severe.
Regulators, lenders, and communities are watching industrial water use much more closely.
For heavy industry, steel, cement, chemicals, food and beverage, automotive, and recycling, water is not a side topic. It is a core production input. You need it to cool, quench, rinse, wash, scrub, and move heat.
The good news is that the same projects that reduce freshwater intake and discharge often cut energy use and GHG emissions at the same time. Closed-loop water recycling from quench lines through wash bays is one of the clearest examples of this “water plus carbon” opportunity.
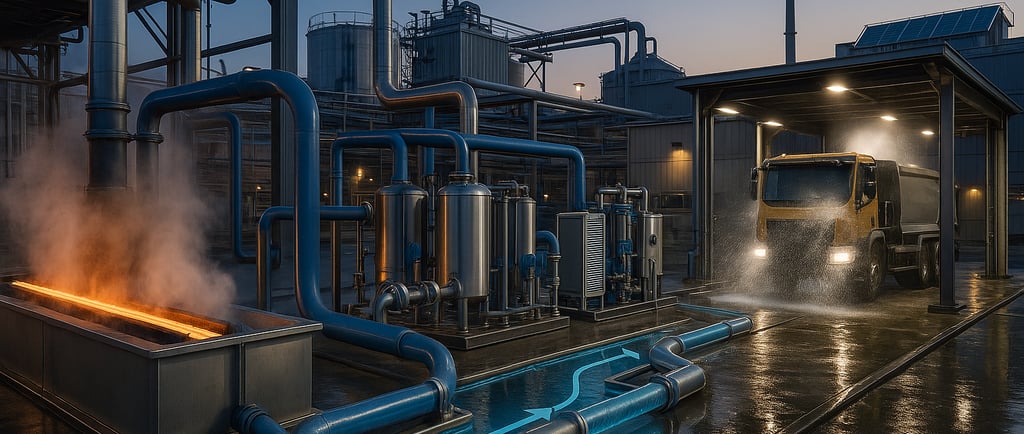
From Quench to Wash Bays: How Water Really Moves in a Plant
Every large industrial site has its own layout, but the basic water story repeats across facilities and sectors.
Typical high-impact uses include:
Quench systems: Rapid cooling of hot product or equipment in mills, foundries, and heat-treat lines.
Process cooling: Indirect cooling of furnaces, compressors, moulds, hydraulic systems, and power equipment.
Rinse and spray systems: Paint shops, surface treatment, pickling, and parts washing lines.
Wash bays: Vehicle washing, container washing, floor and equipment cleaning.
Dust control, gas cleaning, and scrubbing: Spray towers, scrubbers, and mist systems.
In a steel plant, for example, water supports almost every major step. Studies show average water intake around 28 cubic meters per tonne of crude steel, with most of that water discharged again after treatment and cooling, while net consumption sits closer to 2 to 5 cubic meters per tonne. MDPI+1 Similar stories show up in other sectors: huge withdrawals, large discharge flows, and relatively modest net consumption.
This is why “loops” matter. If you can keep more of that water circulating inside the plant instead of pulling fresh water and dumping used water, you:
Reduce your exposure to local scarcity or supply interruptions.
Cut the energy you spend on heating, cooling, and pumping.
Shrink the emissions linked to that energy.
Reduce treatment, discharge, and compliance burdens.
What Exactly Is a Water Recycling Loop
At its simplest, a recycling loop is a closed or semi-closed circuit where water:
Performs a job in the process.
Is collected instead of sent to drain.
Gets treated to remove contaminants and adjust temperature.
Returns to the same or a related process at a quality that still meets spec.
The “loop” can sit at several levels in a facility:
Equipment-level loops, for example around a single quench tank or wash bay.
Line-level loops, for example a set of paint shop rinse stages or a pickling line.
Plant-level loops linking multiple processes and utility systems.
Typical treatment steps include:
Screening and settling for large solids.
Filtration or ultrafiltration for fine particles.
Oil and grease separation for wash and rinse water.
Biologic or chemical treatment for organic loads where needed.
Cooling towers and heat exchangers to control temperature.
The design question is not only “can I reuse the water” but “where can I reuse it at the right quality with the least treatment energy.” That is where quench, rinse, and wash bays often work well together.
Why Quench and Wash Bays Are Natural Anchors
Quench tanks and wash bays sit at opposite ends of many production flows, but both are ideal entry points for serious water recycling.
Quench systems
Handle very high heat loads.
Often already run in recirculating mode.
Can integrate heat exchangers that recover heat to preheat combustion air, boiler feedwater, or cleaning baths.
Wash bays and rinse lines
Are visible to auditors, visitors, and communities.
Carry a mix of oils, detergents, fine solids, and sometimes metals.
Put direct pressure on discharge permits and local sewer or surface water quality.
If you connect these areas with smart loops, you can use heat from quench operations to preheat process or cleaning water, then feed treated water onward to wash bays, then polish it again and return it to upstream use. You cut both thermal and volume waste with one structure.
The Water-Energy-Carbon Link in Numbers
Water and energy are tightly coupled. Every cubic meter you heat, cool, or pump carries an energy cost. That energy usually comes with Scope 1 or Scope 2 emissions.
A simple illustration:
Heating 1 cubic meter of water by 40 degrees Celsius can require roughly 46 kilowatt-hours of thermal energy before boiler losses. At typical industrial boiler efficiencies, actual fuel use is higher.
Large plants often move thousands of cubic meters per day through hot cleaning stages, pasteurizers, or CIP systems.
If a water loop allows you to reuse hot water instead of starting again from cold mains each time, you:
Cut fuel burned in boilers.
Reduce load on cooling towers and chillers.
Reduce electricity consumed by pumps and fans.
At grid carbon intensities that often range from 300 to 800 grams of CO2 per kilowatt-hour in coal-heavy markets, these savings quickly show up as measurable tonnes of CO2 equivalent avoided. Even in markets with cleaner grids, avoided energy typically lines up with lower operating cost and lower risk from future carbon prices. IEA+1
Why Life Cycle Assessment (LCA) Belongs in Every Water Discussion
Your part 2 already speaks in the language of LCAs. Part 1 needs to prepare the reader for that.
Life Cycle Assessment provides a structured way to quantify the full environmental load of a product, process, or service. Instead of focusing only on one utility bill or one emission point, LCA tracks impacts across:
Upstream resource extraction and supply.
On-site operations.
Downstream treatment and disposal.
For water loops, LCA is useful because it:
Allocates emissions to specific streams, for example heating and pumping a quench loop versus buying fresh municipal water.
Prevents “burden shifting,” for example saving water but using far more energy or chemicals than before.
Connects water reuse choices to Scope 1, 2, and 3 inventories and helps explain results to investors and regulators.
Many recent studies in steel, chemicals, and energy use LCA to show how closing water loops reduces both freshwater use and GHG intensity per unit of output. ScienceDirect+2mattech-journal.org+2 When you build your water strategy on LCA rather than on a single metric, you get a clearer view of where water recycling generates real climate value and where it does not.
Common Levels of Maturity in Water Management
Across hundreds of plants, you can roughly see four maturity stages. Describing these stages helps readers locate themselves before they look at your case studies and cost analysis.
Stage 0: Once-through, reactive
Pull water from river, municipal supply, or well.
Use it once for cooling, quenching, or washing.
Discharge it with minimal treatment.
Compliance is handled as a cost, not a design constraint.
Stage 1: Basic reuse
Some recirculation around cooling towers or closed heat exchangers.
Limited separation of “cleaner” and “dirtier” streams.
Investments decided mostly on near-term cost, not long-term risk.
Stage 2: Process-level loops
Clear segregation between high-quality and contaminated streams.
Dedicated loops around quench, rinse, and wash operations.
More advanced filtration and thermal recovery.
Early use of LCA, sometimes in one-off studies.
Stage 3: Integrated plant-wide strategy
Explicit freshwater targets in cubic meters per unit of output.
Multiple loops connected, with heat recovery between them.
Continuous monitoring of water, energy, and emissions.
Use of digital twins or decision support tools to test new projects and control strategies. arXiv
Most sites today sit between Stage 1 and 2. The case studies you present in part 2 essentially show examples of Stage 2 and early Stage 3. Giving readers this ladder in part 1 helps them benchmark where they stand and what “good” looks like.
Risk, Regulation, and Reputation
Water loops are sometimes sold inside companies purely on cost savings. That is valid, but incomplete. The real strategic pressure points include:
Regulatory limits on abstraction and discharge. Many regions now tighten industrial licenses when rivers or aquifers show stress. UNESCO Documents+1
Community perception. Dirty wash water or visible plumes from once-through cooling can turn local opinion very quickly.
Business continuity. During droughts, plants without internal resilience lose production days first.
Finance and ESG. Banks and investors increasingly ask for clear water and climate plans, not general ESG promises.
Water recycling loops directly address all four: lower net withdrawals, better discharge quality, higher resilience in scarce periods, and good evidence for lenders and insurers. For many operators, especially in water-stressed basins, this risk argument matters even more than the pure payback calculation.
Designing Loops: Quality “Fit for Purpose”
One of the most frequent design mistakes is over-treatment. Plants install high-end treatment for all loops and all uses, then face high energy and chemical bills and disappointing returns.
The key principle is “fit for purpose”:
High-purity processes such as boiler feedwater or certain rinses may require advanced membrane systems.
Quench loops and many wash bays can run safely on water that is far from drinking quality, as long as solids, oils, corrosive species, and biological growth are controlled.
Cascading water from cleaner uses to dirtier uses, and finally to discharge, reduces total treatment load.
In part 2, when you describe membrane bioreactors in dairy or ultrafiltration in steel, readers who have seen this principle explained will understand why those technologies were chosen for specific loops, not for the entire plant.
Digitalization and Control from Day One
Your future trends section already talks about AI-based optimisation. Before that, part 1 should make the basic case for smart measurement and control.
For a typical recycling loop you want at minimum:
Flow meters on key supply, return, and blowdown lines.
Temperature sensors where heat recovery is planned.
Basic water quality measurements, at least turbidity and conductivity, plus specific contaminants where needed.
Simple dashboards that link these values to energy and carbon metrics, not only to compliance.
Plants that install meters and logging from the beginning usually find additional savings beyond the original project scope. They also collect the data needed to support the LCAs and business cases that your part 2 discusses.
Where Should a Plant Start
Most facilities do not have the budget or appetite for a big-bang redesign. They need a path that fits around maintenance windows and CapEx cycles.
Good starting candidates are usually:
Quench systems with hot discharge water that currently goes straight to drain.
High-volume wash bays where water use is visible and easy to communicate internally.
Rinse lines that already run on recirculation but use more fresh makeup water than necessary.
A sensible sequence looks like this:
Map your water and energy flows from quench to wash bays. Use real meter data where you have it, and best estimates where you do not.
Identify loops where a single project can reduce both net water use and energy demand.
Prioritise loops that also touch regulatory or reputational hot spots.
Design pilots that collect good data for LCA and ROI analysis from day one.
That mapping and prioritisation step is what sets up the case studies and cost analysis in your existing text.
Setting Up the Reader for Part 2
By this point, the reader should understand:
Why industrial water use is a strategic climate and business issue.
How water moves from quench systems through rinse stages to wash bays.
What a recycling loop is, and how it links to energy and GHGs.
How maturity levels in water management differ between plants.
Why LCAs, risk, and resilience belong in every water investment discussion.
With that foundation, you can now walk the reader through concrete examples of how leading operators have already applied these ideas.
The next section, “Real-World Case Studies: Water Recycling and Decarbonization in Action,” shows how automotive, food and beverage, and metals producers closed water loops, cut energy and emissions, and recovered their investment in realistic timeframes.
Real-World Case Studies: Water Recycling and Decarbonization in Action
The decarbonization impact of water recycling is not just theoretical; data-backed case studies from major industries across the world highlight significant operational, financial, and environmental benefits. These examples can serve as models for sustainability leaders aiming to drive ambitious net-zero progress.
1. Automotive Manufacturing: Closing the Loop in Paint Shops
According to the International Energy Agency (IEA), the automotive sector is responsible for approximately 5% of global industrial energy usemuch of which is tied to water-intensive painting and finishing lines. A leading U.S.-based automotive manufacturer recently revamped its operations by implementing a closed-loop water recycling system within its paint shop rinse stations.
Key outcomes:
Water use cut by 40%: Recycling process water allowed for a dramatic reduction in freshwater withdrawals.
20% reduction in energy used for water heating: Recaptured thermal energy from recycled rinse tanks preheated incoming water.
GHG emissions drop of 8,000 tons/year: Optimized water recycling directly translated to Scope 2 emission savings calculated via LCA.
ROI achieved in under three years: Savings from water, energy, and reduced treatment chemicals paid back the system retrofit quickly.
This case illustrates how integrating water management into broader decarbonization strategiesusing LCA metricscan boost both operational efficiency and climate performance.
2. Food & Beverage: Smart Filtration Protects Water and Reputation
One of Europe’s largest dairy producers faced both regulatory and reputational pressure to cut emissions while operating in a water-stressed basin. By introducing advanced membrane bioreactor (MBR) systems to recycle wash bay water, the facility achieved the following:
90% effluent volume reduction: Resulted in lower regulatory fees and positive stakeholder visibility.
Annual energy demand slashed by 650 MWh: Due to significant reductions in water pumping and pre-heating needs.
Brand value lift: Transparent reporting of decarbonization steps (validated through LCA) enhanced stakeholder engagement and ESG performance.
These numbers reflect not just compliance, but increased trust and brand strength in a sustainability-conscious marketplace.
3. Metals Manufacturing: Thermal Recovery for Quench Loops
Heavy industryparticularly metalshas traditionally consumed vast quantities of both water and energy in quenching and cooling lines. A prominent steel mill in China implemented thermal recovery and modular ultrafiltration in its quench tank operations:
Energy savings of 15% per unit of output: Primarily through the integration of heat exchangers and water reuse in closed-loop circuits.
Reduced GHG emissions intensity by 2.3 kg CO2e/ton steel: Measured using ISO 14040-compliant LCAs.
Water use dropped by 50%: A transformational improvement with a direct bottom-line impact.
These case studies spotlight the synergistic relationship between water recycling, energy management, and lifecycle-based carbon reduction.
Cost-Benefit Analysis: Quantifying Water Loop Investments
Calculating the return on investment (ROI) for water recycling systems requires a clear understanding of overlapping cost centers and hidden value streams. Here’s how sustainability leaders can build the business case using real, quantifiable data:
Direct Savings
Reduced freshwater purchase: Average industrial water prices globally range from $0.50–$2.00 per cubic meter; recycling can drop net costs by 30–80% based on system efficiency.
Lowered wastewater treatment/disposal fees: Many facilities face rising discharge tariffs; on-site recycling trims these recurring expenses.
Decreased chemical/energy inputs: Less water to heat, cool, or treat, directly reducing energy bills often by 10–30% depending on starting inefficiencies.
Indirect and Intangible Value
Compliance streamlining: Automated water balance and pollutant tracking simplifies reportingcutting administrative time and risk of fines.
Resilience premium: During water scarcity events, internal recycling insulates facilities against shutdowns or costly water purchases on spot markets.
Enhanced ESG ratings: Demonstrated decarbonization (especially when evidenced in LCAs) often improves access to green finance and investor confidence.
Payback Periods in Practice
A 2023 global manufacturing survey by McKinsey found that typical payback periods for closed-loop water recycling installations range from 2 to 5 years, with the best performers integrating real-time analytics and advanced treatment to optimize both water and energy use.
Blueprint for Implementation: Operationalizing Water Recycling Loops
Moving from strategy to results means building a tailored, phased plan. Here are the key action steps, grounded in industry best practice:
Step 1: Baseline and Benchmark with LCA
Conduct comprehensive water and energy mapping using modern digital tools.
Model baseline GHG emissions with a process- or facility-specific LCA, clarifying “hot spots” for intervention.
Engage internal and external stakeholders early to define success metrics aligned with both decarbonization and operational resilience.
Step 2: Technology Selection
Evaluate filtration, thermal recovery, and recycling technologies not just for technical fit, but also for lifecycle environmental benefits.
Prioritize modular, upgradeable systems that allow incremental scalingminimizing both CapEx and disruption.
Select smart controls and IoT monitoring for real-time optimization of energy and water flows.
Step 3: Phased Rollout and Continuous Optimization
Launch with a pilot loop on a high-impact process (e.g., quench, rinse, or wash bay). Validate energy/carbon/water saving assumptions with operational data.
Use LCA to re-calculate and document actual gains; adapt technology or process parameters to maximize impact.
Expand loops facility-wide, building upon initial successes and integrating lessons learned to cut energy and emissions further.
Step 4: Measure, Report, and Certify
Establish robust monitoring for water, chemical, energy, and emission metricsleveraging cloud-based platforms for transparency.
Publicly report successes in sustainability/ESG disclosures to drive brand value and stakeholder buy-in.
Consider third-party certifications (e.g., ISO 14046 Water Footprint, Green Building Council programs) to validate decarbonization claims.
Future Trends: Next-Gen Water Decarbonization Solutions
As decarbonization pressures mount, water recycling loops are evolving rapidlydriven by digitalization, AI, and stricter lifecycle reporting. Forward-looking organizations should monitor these developments to future-proof their operations:
1. AI-Driven Optimization
Next-generation systems leverage AI to continuously track and optimize every aspect of water recyclingpredicting maintenance, adjusting flows for peak efficiency, and automating compliance tasks.
2. Integration with Renewable Energy
Facilities are linking solar or wind energy inputs directly to water recycling plants, further lowering Scope 2 emissions and improving resilience.
3. Advanced LCAs for Water-Energy Nexus
Lifecycle assessment tools are becoming more granular, enabling organizations to pinpoint water-related GHG “hot spots” at the process or even equipment level, and tailor interventions with unprecedented precision.
4. Circular Water Partnerships
Expect to see increased industrial symbiosis, where recyclable water and heat are exchanged between neighboring plantstransforming waste streams into shared resources and deepening decarbonization potential.
Measuring Long-Term Impact: Maintaining Sustainable Decarbonization
Sustainability is a journey, not a one-time project. To maintain momentum:
Continue real-time monitoring: Use smart meters to ensure recycled water quality, flow rates, and energy balance meet targets.
Update LCAs regularly: Reflect operational changes and system upgrades in lifecycle analyses to confirm continuous decarbonization.
Foster a sustainability culture: Train staff in efficient water and energy use, rewarding process improvements and innovation.
In conclusion: Water recycling loops are a powerful, multi-dimensional decarbonization tool for any energy-intensive operation. By integrating robust LCAs, leveraging advanced recycling technologies, and embracing digital innovation, sustainability leaders can unlock powerful operational efficiencies, mitigate compliance risks, and set a credible course toward net-zero. Don’t overlook your water strategythe path from quench to wash bay is now central to future-ready operations.
Ready to build a water recycling strategy that accelerates decarbonization in your operations? Reach out for a custom assessment, or explore our library of LCA-backed resources for further guidance on technology, compliance, and real-world case studies.
Connect
Your trusted partner for scrap metal procurement.
CONTACT
About
haroon@tdcventures.com
+1-307-655-7593
© 2025. All rights reserved.
NEWSLETTER